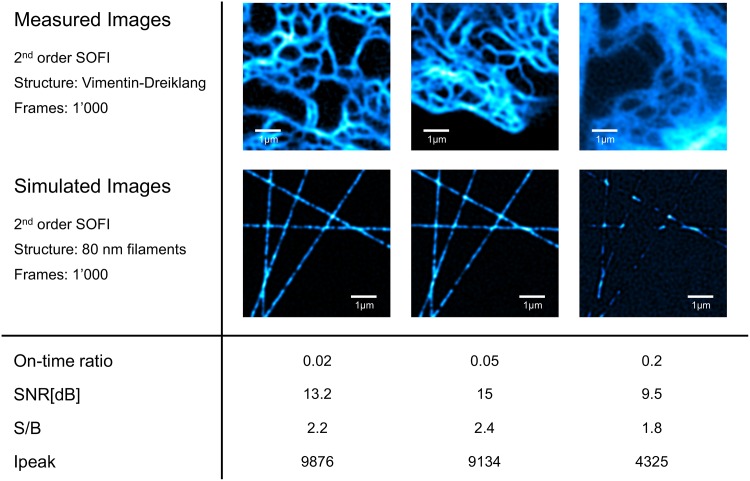
Fig 7. Experimental data compared to simulations.
(a)-(d) 2nd order bSOFI images computed from experimental data. (e)-(h) 2nd order bSOFI images computed from simulated data. Table below the figure shows the parameters estimated from experimental data and used for the simulations. S/B and Ipeak denote respectively the signal-to-background ratio and the intensity peak of the average images. Density for simulation was set to 600 fluorescent proteins per micrometer.

