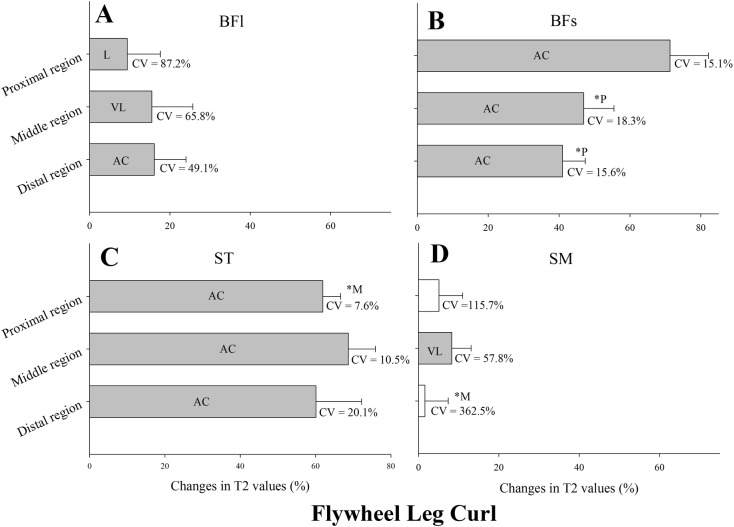
Fig 3. Mean, standard deviation and coefficient of variation (CV) of the change in the transverse relaxation time (T2) of the proximal, middle and distal regions of the biceps femoris long head muscle (BFl) and short head muscle (BFs), semitendinosus muscle (ST), and semimembranosus muscle (SM) immediately after four sets of eight repetitions of flywheel leg curl exercise.
All values are given as a percentage of the pre-values. Closed bars represent substantial changes (L, likely; VL, very likely; AC, almost certain) while open bars display non-substantial changes. Asterisks indicate substantial differences between muscle regions.

