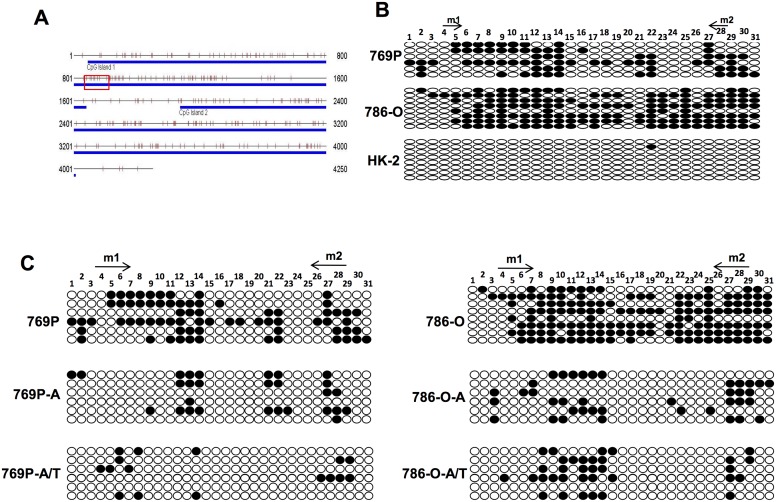
Fig 3. Bisulfite genome sequencing (BGS) analysis of the promoter CpG sites.
(A) Two CpG islands were found within CCND2 promoter region, the red square marked MSP tested sites. (B) Bisulfite genomic sequencing of each CpG site (oval) in CCND2 promoter region was performed in 769P, 786-O and HK-2 cell lines. Arrows: MSP primers binding sites; Solid oval: methylated CpG site; Hollow oval: unmethylated CpG site. (C) BGS analyzed the methylation of CpG sites after drug treatment in RCC cell lines.

