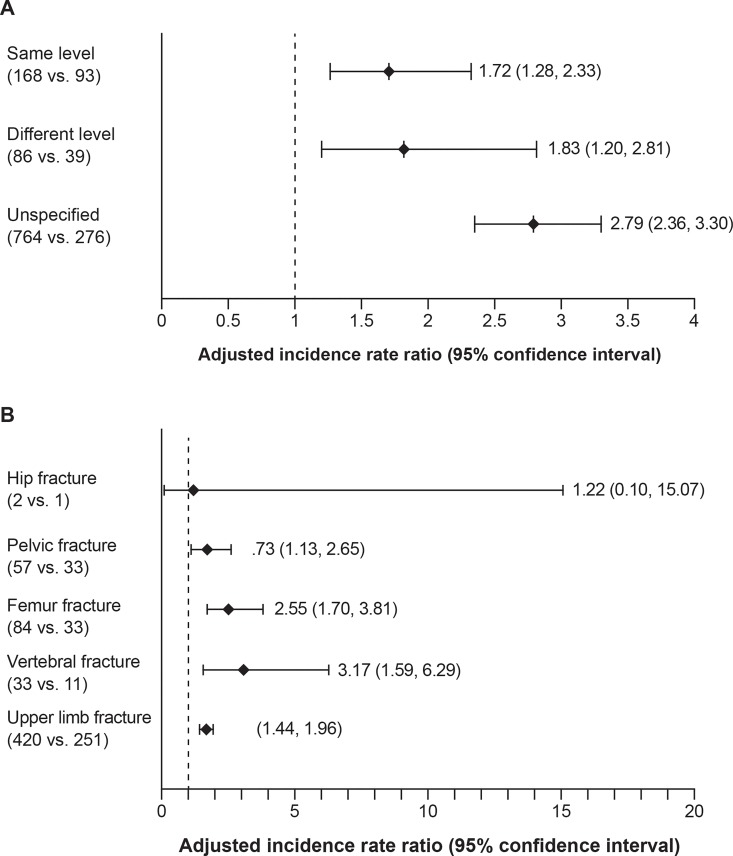
Fig 1. Adjusted incidence rate ratios of by types of falls and fractures.
* (A) Adjusted incidence rate ratios by types of falls. (B) Adjusted incidence rate ratios by types of fractures. *The incidence rate ratios were adjusted for age, gender, region of residence, and duration of enrollment. Numbers in the parentheses under each type of falls/fractures were numbers of cases in the PD and non-PD cohorts, respectively. PD, Parkinson’s disease.

