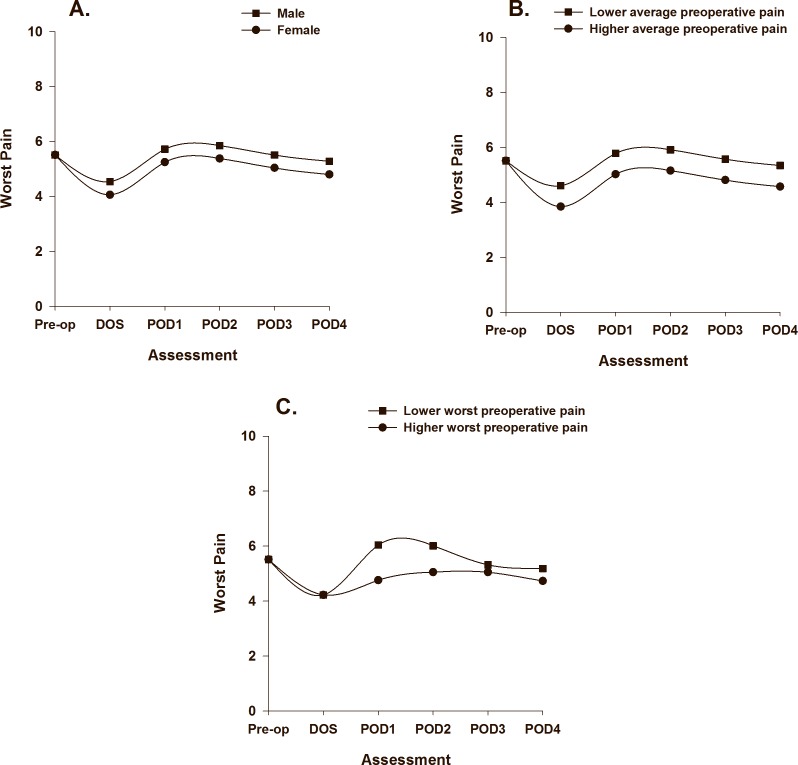
Fig 4.
Trajectories of worst pain by gender (A), average preoperative pain intensity prior to surgery (B), and worst preoperative pain intensity (C) from before surgery until postoperative day 4. Higher/lower differences in Fig 4 B to C were calculated based on 1 standard deviation above/below the mean. The coefficients are adjusted for all other variables in the model.

