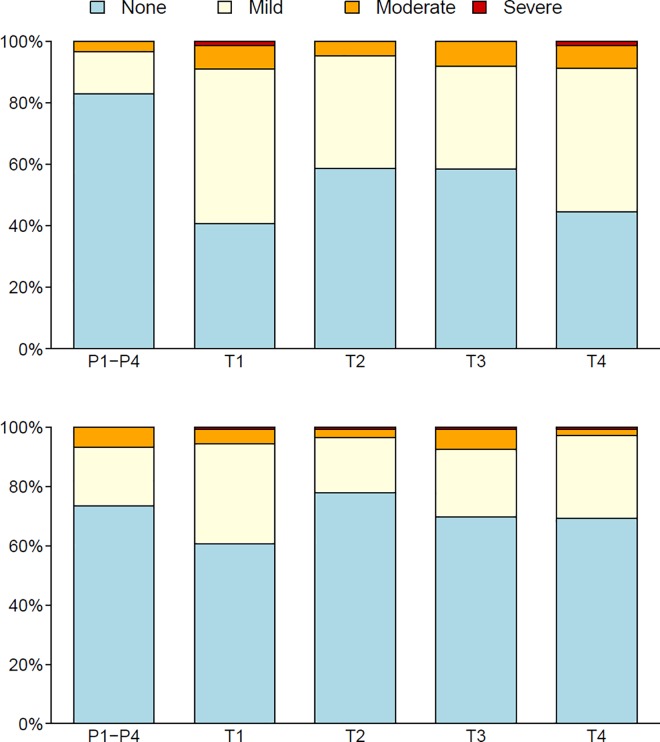
Fig 2. Local and systemic reactinogenicity by treatment group.
Local and systemic reactinogenicity for the pooled placebo and each vaccine regimen (T1-T4) are shown in the top and bottom panel respectively. None, mild, moderate and severe reactions are colour coded blue, yellow, orange and red respectively. T1: MVA prime, sequential gp140 boost (M/M/P/P); T2 (MP/MP): concurrent MVA/gp140; T3 (D/D/M/M): DNA prime, sequential MVA boost; T4 (D/D/MP/MP): DNA prime, concurrent MVA/gp140 boost) or placebo. Two-sided unadjusted p-values from Fisher’s exact tests were used to compare proportions of participants that had local or systemic reactions between each pair of vaccine arms.

