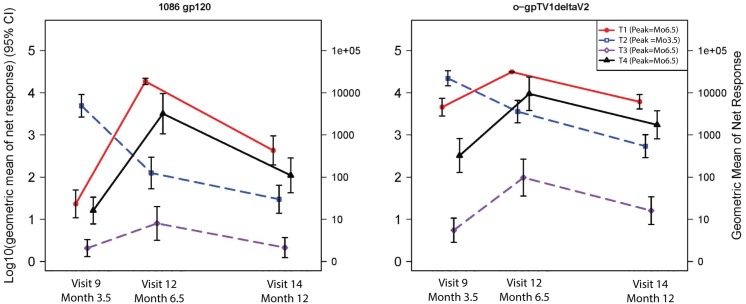
Fig 8. Kinetics of IgG binding antibody responses.
The geometric mean (and 95% error bars) of net responders are shown for visit 9, 12 and 14. T1: MVA prime, sequential gp140 boost (M/M/P/P), peak responses at visit 12; T2: concurrent MVA/gp140 (MP/MP), peak responses at visit 9; T3: DNA prime, sequential MVA boost (D/D/M/M), peak responses at visit 12; T4: DNA prime, concurrent MVA/gp140 boost (D/D/MP/MP), peak responses at visit 12. The decay kinetics time point was measured at visit 14, 6 months after last vaccination of M/M/P/P, D/D/P/P and D/D/MP/MP and 9 months after last vaccination of MP/MP.

