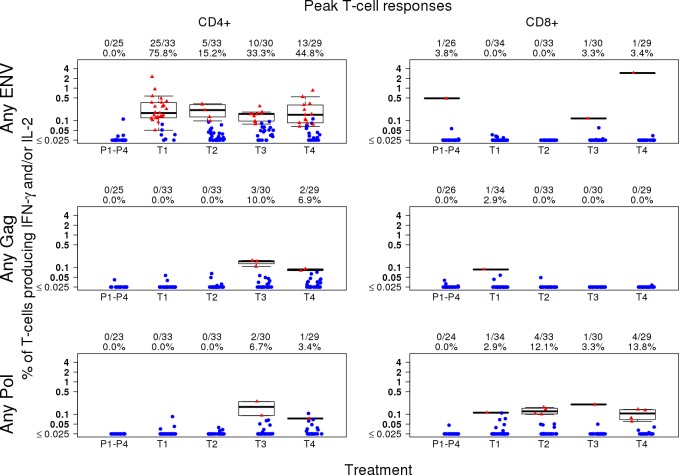
Fig 9. Peak T-cell responses to vaccine antigens.
CD4+ and CD8+ background-adjusted T-cell responses as determined by intracellular cytokine staining 2 weeks following the fourth vaccination in groups 1, 3 and 4 (month 6.5) and following the second vaccination in group 2 (month 3.5). Because of overlap of peptides between PTEg peptide pools for the same HIV protein, the magnitude for the protein is calculated as the maximum among the peptide pools for the protein. The overall magnitude is calculated as the sum of the individual HIV protein magnitudes. Plots include data from responders in red and non-responders in blue. Box plots based upon data from responders only are superimposed on the distributions. The mid-line of the box denotes the median and the ends of the box denote the 25th and 75th percentiles. The whiskers that extend from the top and bottom of the box extend to the most extreme data points that are no more than 1.5 times the interquartile range (i.e., height of the box) or if no value meets this criterion, to the data extremes. The number and percent positive responders in each group are shown above the graphs. Placebo recipients from all treatment groups are shown together. T1 (M/M/P/P): MVA prime, sequential gp140 boost; T2 (MP/MP): concurrent MVA/gp140; T3 (D/D/M/M): DNA prime, sequential MVA boost; T4 (D/D/MP/MP): DNA prime, concurrent MVA/gp140 boost) or placebo.

