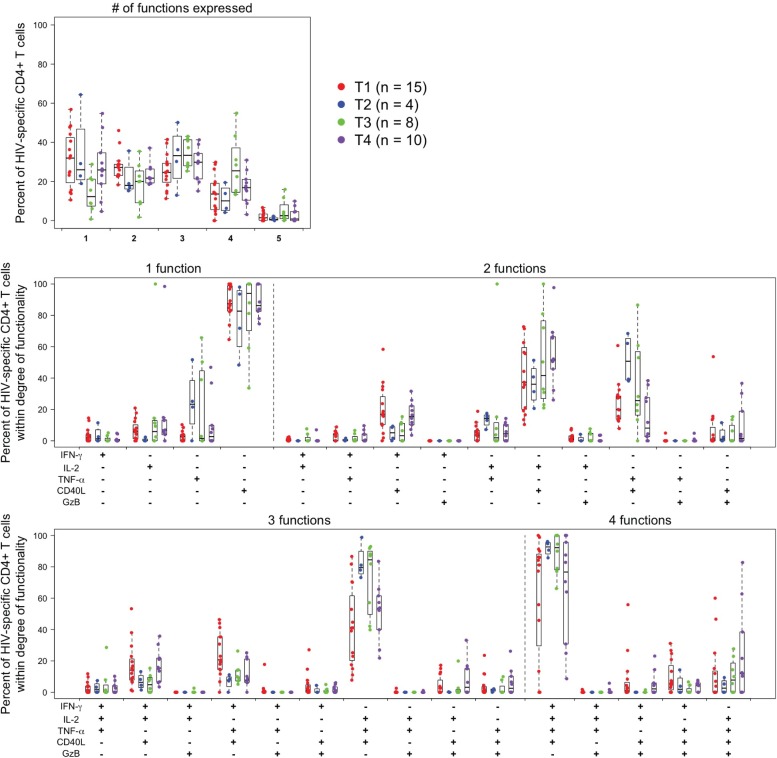
Fig 10. Polyfunctionality analysis of peak CD4+ T-cell Env-specific responses.
Only responses positive for IFN-γ and/or IL-2 are shown; data are for the Env pool with the largest response within each individual at the peak timepoint for each treatment group. The upper left graph shows the proportion of Env-specific cells expressing the indicated number of functions. Total Env-specific cells are determined as cells producing any of the 5 functions alone or in combination, except that granzyme B must be co-expressed with another function since it is constitutively expressed. The next graphs show the proportion of cells within each degree of functionality expressing the indication combinations of functions. T1 (M/M/P/P): MVA prime, sequential gp140 boost; T2 (MP/MP): concurrent MVA/gp140; T3 (D/D/M/M): DNA prime, sequential MVA boost; T4 (D/D/MP/MP): DNA prime, concurrent MVA/gp140 boost) or placebo.

