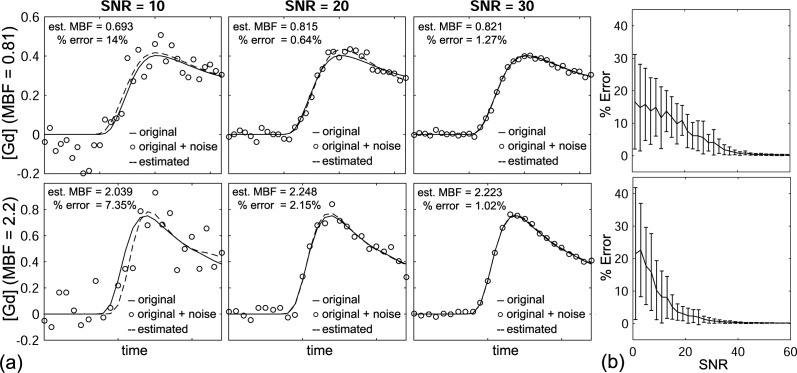
Fig 8.
Plots simulated with (top) MBF = 0.81 and (bottom) MBF = 2.2. (a) Simulated (or original; solid line), White Gaussian noise added (circle), and estimated from NTHf (dashed line) plots are shown at SNR = 10, 20, 30. (b) Percent errors for a range of SNR = 0–60 showing average and two standard deviation error bars (each SNR was repeated 30 times).

