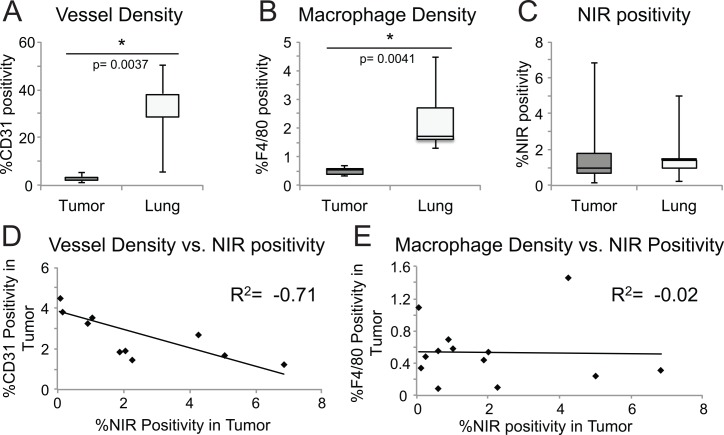
Fig 5. Histology based characterization.
Histology of tumor and normal lung compares boxplots of (A) vessel density p = 0.0037 (A), and (B) macrophage density p = 0.0041 (B) student’s t-test demonstrating they are lower in tumor compared to lung. However (C) NIR positivity is overall slightly increased and more variable in tumor. Correlation between vessel density and NIR positivity (D) is strongly negative whereas macrophage density (E) is not correlated to NIR positivity.

