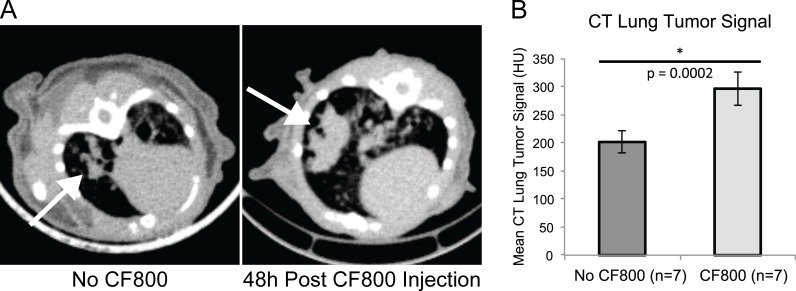
Fig 6. Representative CT axial images of mouse lung.
(A) CT axial images of mouse lung with no CF800 injection (left) and at 48h post-CF800 injection (right). The arrows point to the location of the lung tumor. Both images are displayed at the same window and level. Note the higher CT signal observed in the tumor of the mouse injected with the CF800 agent. (B) Bulk tumor analysis demonstrating CF800 injected mice have a higher tumor signal than non-injected mice, p = 0.0002.

