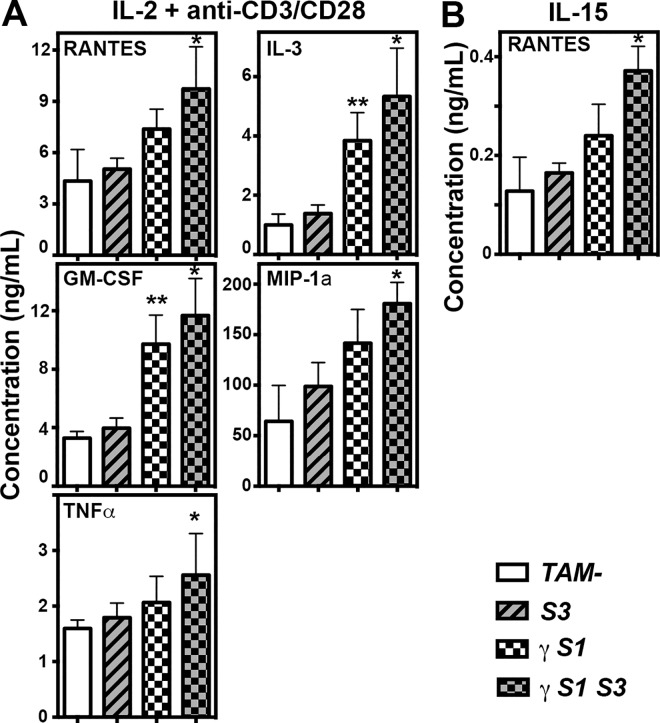
Fig 8. Cytokine and chemokine production by T cells from mice lacking SOCS proteins.
Concentrations of cytokines/chemokines in supernatant of CD8+ T cells 48hr after stimulation with IL-2 plus anti-CD3/CD28 (A) or IL-15 (B). Mean ± SD is shown. CD45.2+CD3+CD8+ T cells were flow-sorted from spleens of mice 14d after tamoxifen or vehicle treatment. Mean ± SD is shown with * p<0.05 for comparison of γS1S3 with TAM- and S3. ** p<0.05 for comparison of γS1 with TAM- and S3, one-way ANOVA with Tukey’s multiple comparisons test, n = 6–7 mice per group.

