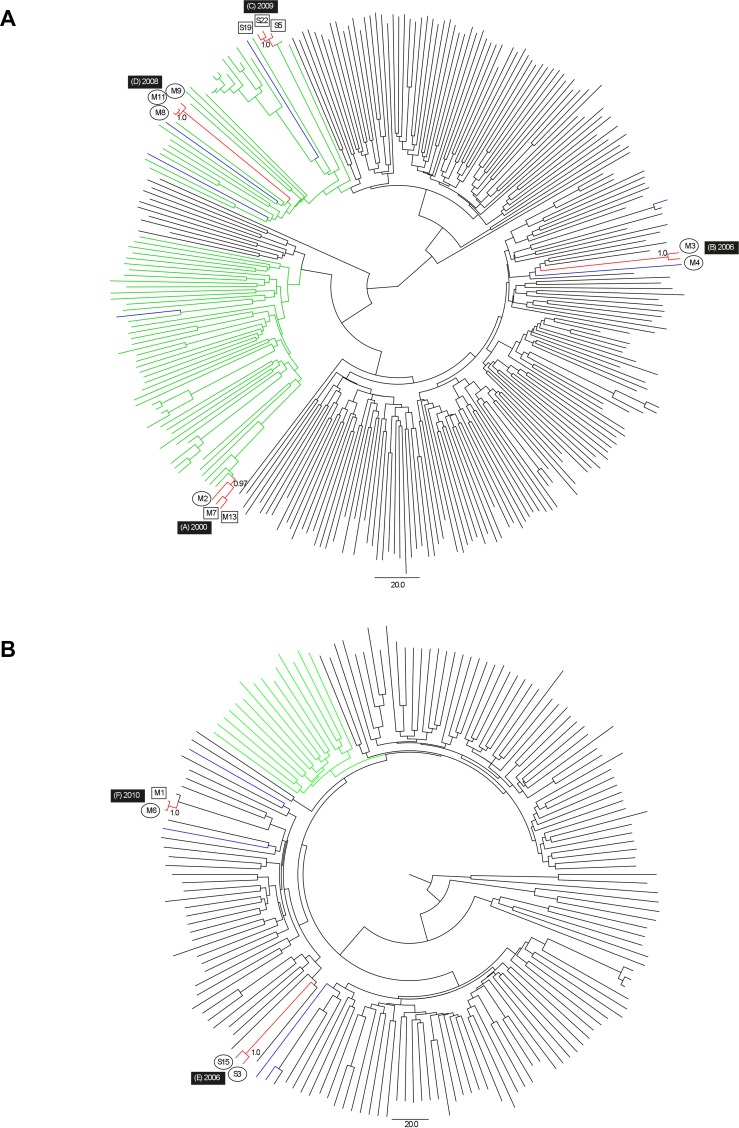
Fig 1.
Bayesian time-scaled phylogenies for HCV genotypes 1a and 3a (upper and lower panels respectively). Red and blue denote sequences from this study that were clustered and non-clustered, respectively. Green denotes other Australian sequences within broader transmission lineages. Participants from Sydney and Melbourne are denoted by ‘S’ and ‘M’ respectively. Circles and squares denote sexual and IDU routes of HCV acquisition, respectively. Clusters are denoted by letters A to F, together with the corresponding time to most recent common ancestor (TMRCA). The scale bar represents time in years.

