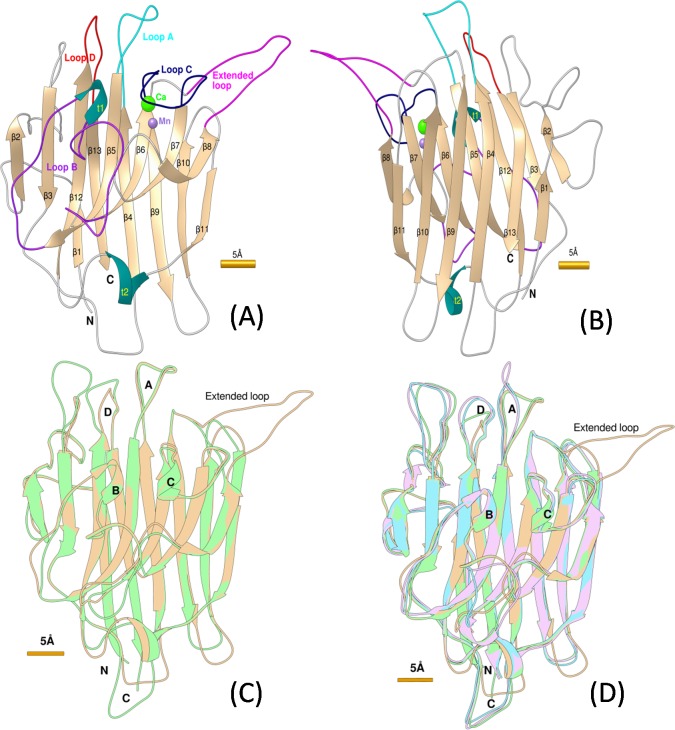
Fig 4. Ribbon style representations of the DORN1 models and superimposed models.
(A) and (B) Backbone alpha-carbon traces of the DORN1 model with 13 defined beta strands (β1 to β13), 4 defined loops (A-cyan, B-purple, C-dark blue, and D-red), 2 β-turns (t1 and t2 in blue), 1 extended loop (magenta), and other loops in front view and back view, respectively. (C) and (D) Backbone alpha-carbon traces of the superimposed models between DORN1 (tan) with the best template (green), and with other selected templates 1BJQ (purple) and 1FAT (cyan). Yellow bars next to the figures denote relative scale of the model in Angstrom unit (1Å = 10-10m).

