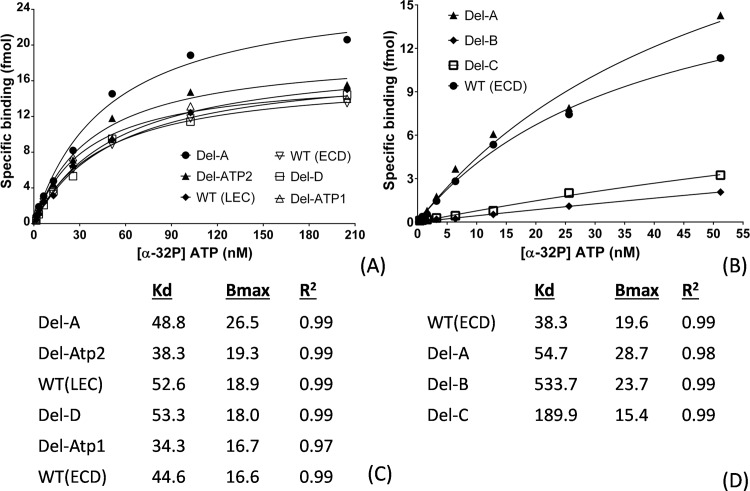
Fig 5. In vitro binding activities of ATP and DORN1 wild-types and deletion mutants.
(A) and (B) Graphical representation of binding activities of ATP and DORN1 wild-types and deletion mutants in vitro using a non-linear regression model (see “Materials and methods” in detail). WT (LEC): lectin domain only, WT (ECD): extracellular domain, Del-A: amino acid deletion in loop A, Del-B: deletion in loop B, Del-C: deletion in loop C, Del-D: deletion in loop D and Del-ExLp1 and Del-ExLp2: deletions in the extended loop. (C) and (D) Corresponding best-fit Kd, Bmax, and R2 values extrapolated from the non-linear regression models of A and B, respectively.

