
Fig 7. Regression plots with individual data from 24 hours treatment of differentiated HC11 cells with LPS.
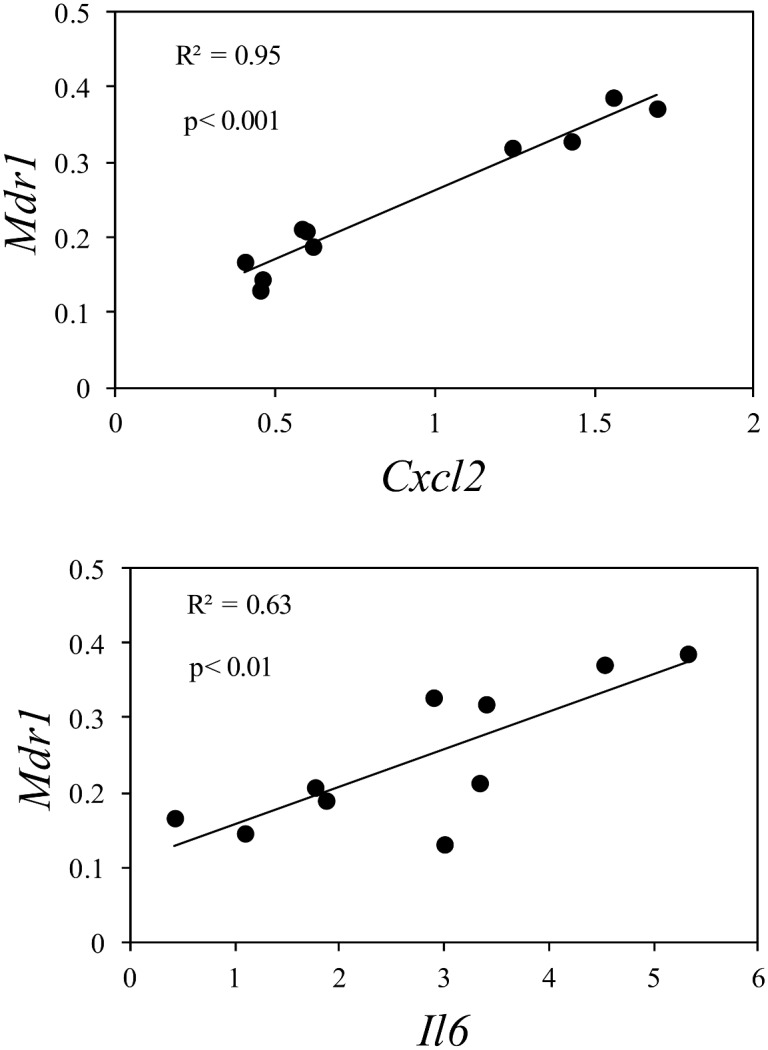
Data from Figs 4 and 5 were analysed by simple linear regression analysis of dependent variable gene expression of Mdr1 and independent variable gene expression of the inflammatory biomarkers Cxcl2 (p < 0.001) and Il6 (p < 0.01).