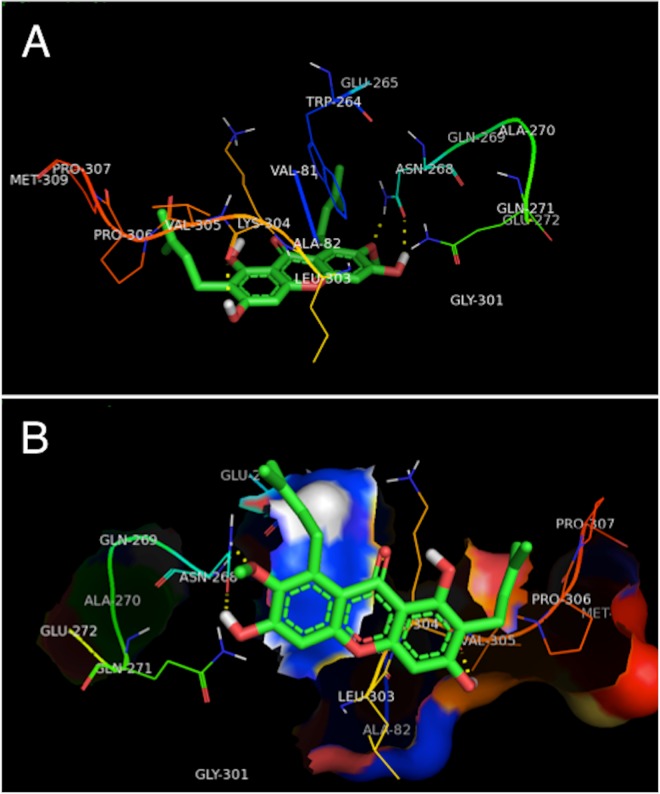
Fig 9.
Interaction mode (A) and hydrophobic surface map (B) between α-mangostin and TRF. Only residues within 10.0 Å of the ligand are displayed. The residues of TRF are represented using line model, and the ligand structure are represented using stick model. The hydrogen bonds between the ligand and the protein are represented by yellow dashed lines.

