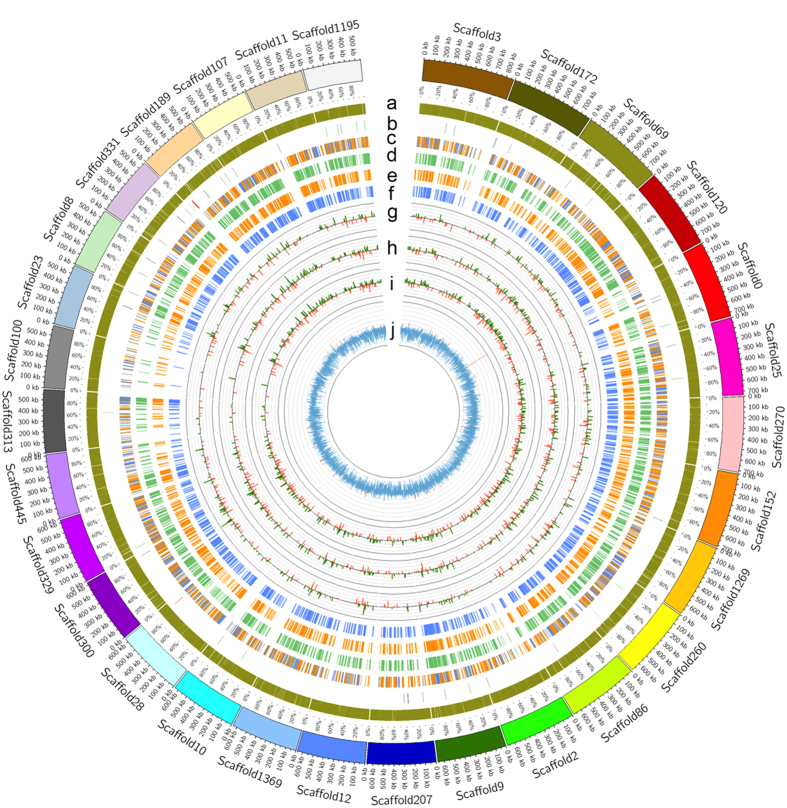
Figure 1. Characterization of the H. brasiliensis genome.
Circos plot of the 30 longest scaffolds. (a) Repeats; (b) Non-coding RNAs (rRNAs, tRNAs and other ncRNAs are represented by red, green and grey lines, respectively); (c) Gene model annotation against the NCBI non-redundant protein database (BLAST matches to R. communis, M. esculenta, J. curcas and other organisms are represented by blue, green, orange and grey lines, respectively); (d) Orthologous genes in M. esculenta; (e) Orthologous genes in J. curcas; (f) Orthologous genes in R. communis; (g) CAGE tags per million (TPM) in latex (TSSs mapped to the sense and antisense strand are represented in green and red, respectively); (h) CAGE TPM in leaf (TSSs mapped to the sense and antisense strands are represented in green and red, respectively); (i) CAGE TPM in bark (TSSs mapped to the sense and antisense strands are represented in green and red, respectively) (j) GC content (values of >50% and < = 50% are represented in red and blue, respectively).

