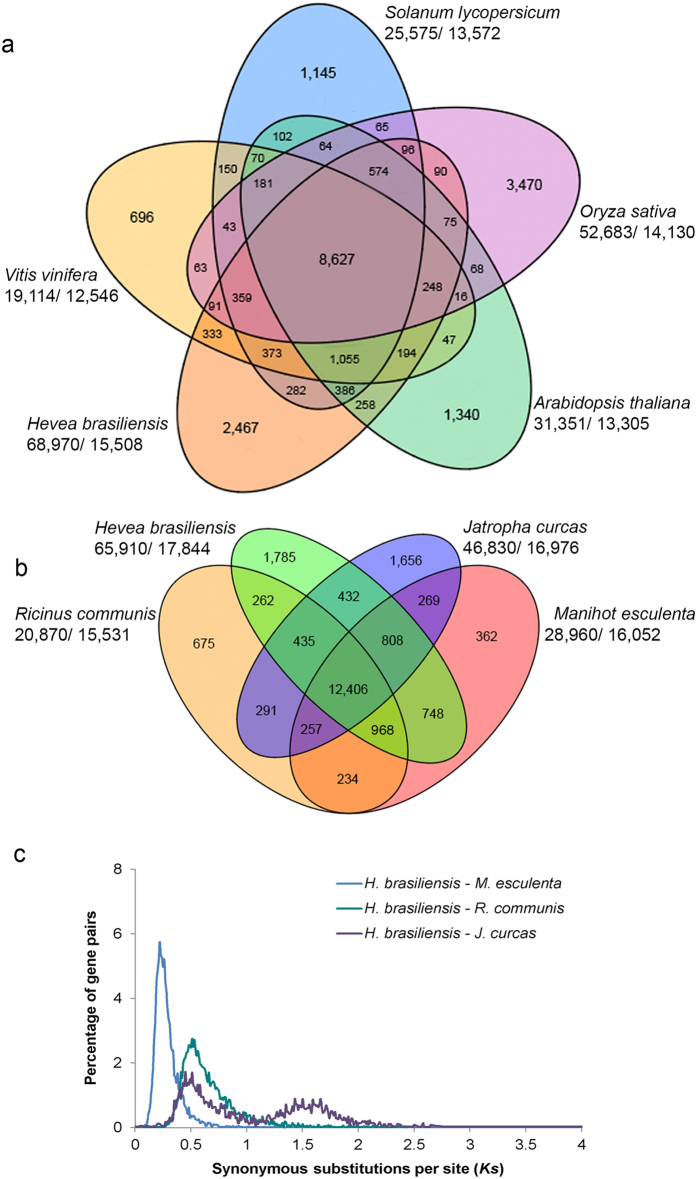
Figure 2. H. brasiliensis comparative genomics.
Venn diagrams show unique and shared gene families between and among representative (a) angiosperms and (b) Euphorbiaceae. The number of genes in the families and the number of gene families are indicated under each species name. (c) Distribution of synonymous nucleotide substitution (Ks) rates. The blue, turquoise and purple lines represent the Ks distribution of orthologous gene pairs in H. brasiliensis-M. esculenta, H. brasiliensis-R. communis and H. brasiliensis-J. curcas, respectively. 8,136, 7,399 and 3,456 single-copy orthologs, were used for the H. brasiliensis-M. esculenta, H. brasiliensis-R. communis and H. brasiliensis-J. curcas analyses, respectively.

