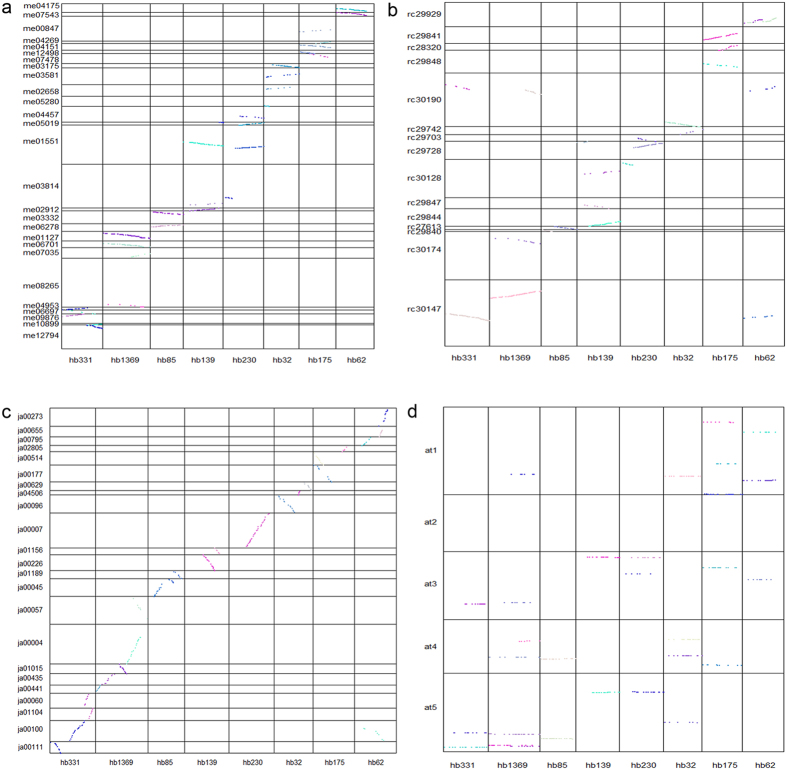
Figure 4.
Dot-plot analyses between H. brasiliensis and (a) M. esculenta, (b) R. communis, (c) J. curcas scaffolds and (d) A. thaliana chromosomes. Each dot represents a collinear gene pair between H. brasiliensis, M. esculenta, R. communis, J. curcas and A. thaliana (BLASTP e-value cutoff < 10−5). Different coloured dots represent different collinear blocks. Eight scaffolds of H. brasiliensis that have more than 15 homologous genes in M. esculenta, R. communis, J. curcas, and A. thaliana are shown.

