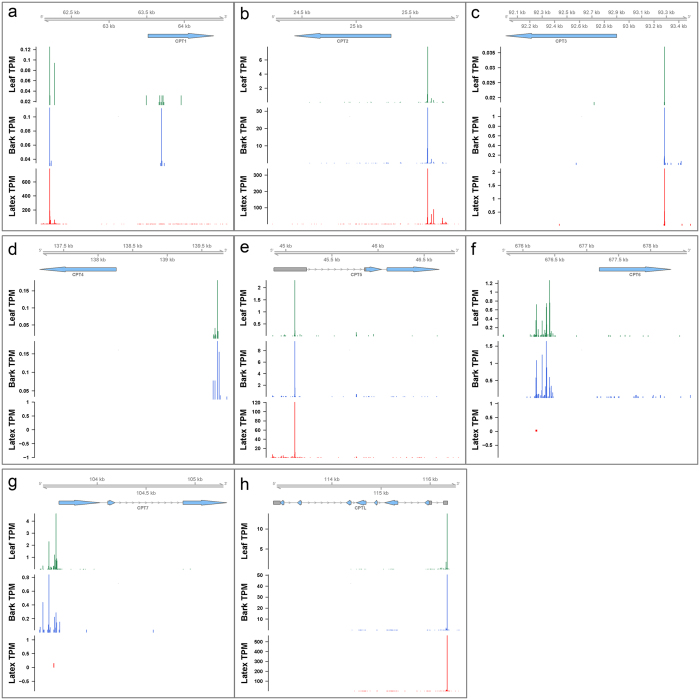
Figure 6.
CAGE tag cluster distribution for (a–g) CPT1-7 and (h) CPTL in leaf, bark and latex. The top arrows represent Maker-P predicted gene structures; grey boxes are 5′/3′ UTR and blue arrows are CDSs. The histograms show normalized expression (TPM) and position of TSSs. Each histogram has a different scale for TPM. The relative locations of each gene in the scaffold are indicated at the top of the figure.

