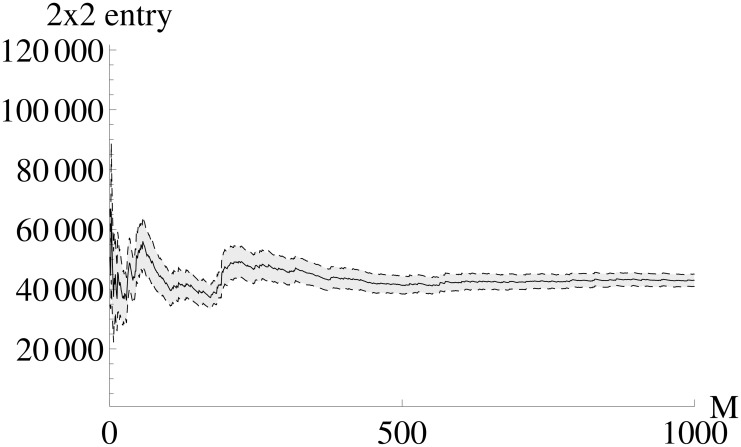
Fig 16. Dependence of the accuracy of the FIMSS entries on the number of pseudo data sets.
The x-axis shows the number of pseudo data sets M used for calculating the 2 × 2 entry of FIMSS, the mean is shown as solid line. Gray color shows the area from sample mean plus / minus one standard deviation. As the width of the gray area is decreasing, the accuracy is increasing. One can see that already small values as M = 400 give a good approximation.

