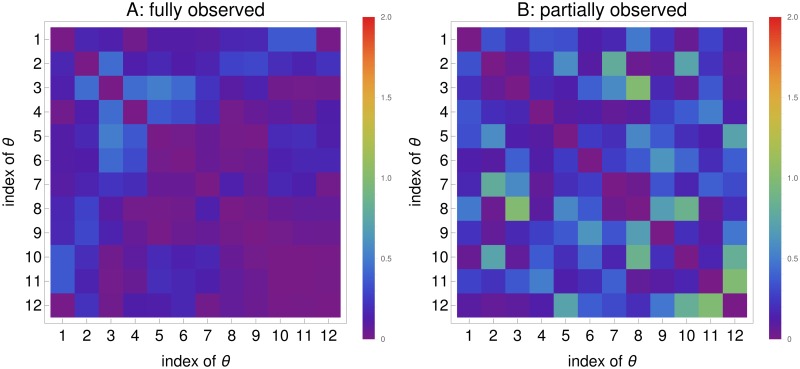
Fig 18. Heat map of the difference of correlations between Corr(FIMSS) and Corremp.
A shows the fully observed Calcium oscillation model and B the partially observed scenario. Two correlation matrices are calculated for each of the cases, one from FIMSS and the other from the estimates. The absolute value of their differences is color-coded.

