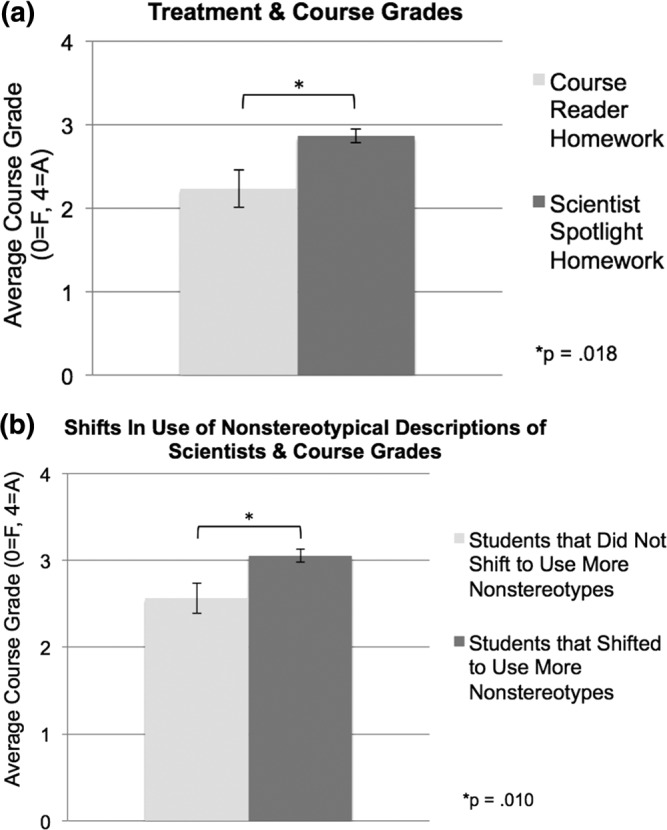
Figure 5.

Average course grades (0 = “F,” 4 = “A”) for Scientist Spotlight Homework students vs. Course Reader Homework students (a) and for students whose proportion of Nonstereotype descriptions of scientists increased vs. did not increase (b). Error bars represent SE.
