
Figure 3.
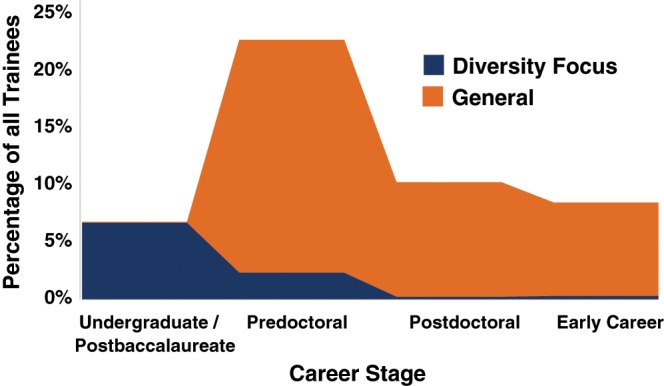
Estimate of Fiscal Year 2015 NIH training/career development participants by career state and diversity focus. An estimate of the percentage of trainees and early-career scientists in 2015 being supported by NIH through traditional training/career development programs (orange) and diversity-focused training/career development programs (blue); data represent participants in the F/T/K module in the NIH Query, View, and Report system, which incorporates individual fellowships/mentored awards as part of the records, as well as appointees currently available in the NIH xTrain reporting system. Approximately 4% of trainees and early-career scientists were not trackable and thus are not mapped onto the career pathway. Diversity Supplement Program participants and participants in the Loan Repayment Program were not included in this estimate. In cases in which programs addressed multiple career stages of a trainee’s career, proportions of trainees/early-career scientists were assigned to each category based on estimates of the distribution of training/career development participant types in that program. Note that, although the figure depicts continuous data in a line graph, the assumption is that there are no intermediate percentages of trainees funded between career stages.