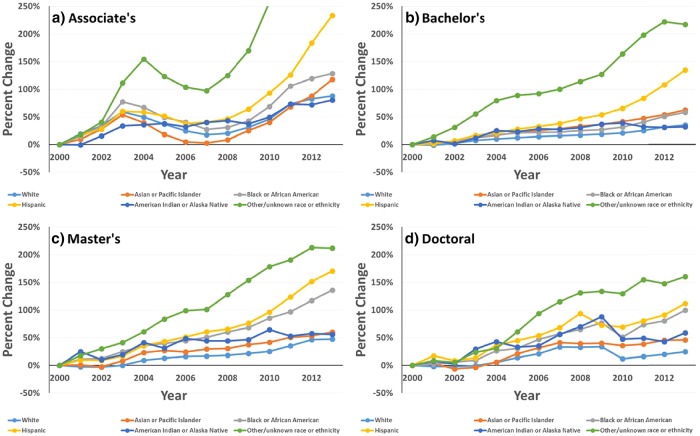
Figure 1.
Percent change from the year 2000 in degrees awarded by race and ethnicity for (a) associate’s, (b) bachelor’s, (c) master’s, and (d) doctoral degrees. Table 1 compares these data with the population growth documented in the 2010 census. Source: National Science Board (2016), appendix tables 2-18, 2-23, 2-29, and 2-33.

