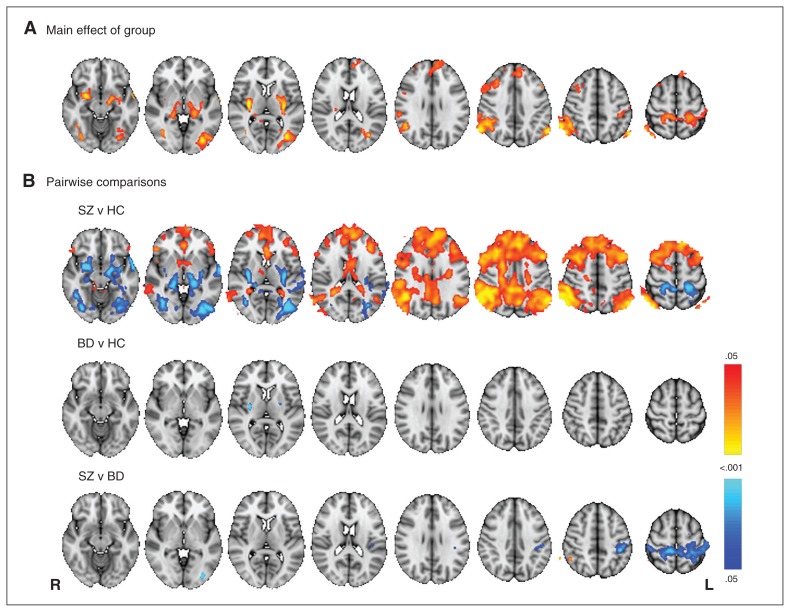
Fig. 1.
Voxelwise analysis showing significant main effects of group on centrality. (A) Results from the F-test showing a main effect of diagnosis on eigenvector centrality. (B) Pairwise comparisons (t tests) among the 3 groups. Red and blue colours show regions with centrality increase and decrease, respectively, in patients compared with healthy controls (HC), and in patients with schizophrenia (SZ) compared with those with bipolar disorder (BD). Effects shown are significant at p < 0.05, corrected for multiple comparisons using nonparametric permutation testing across 5000 iterations and threshold-free cluster enhancement.

