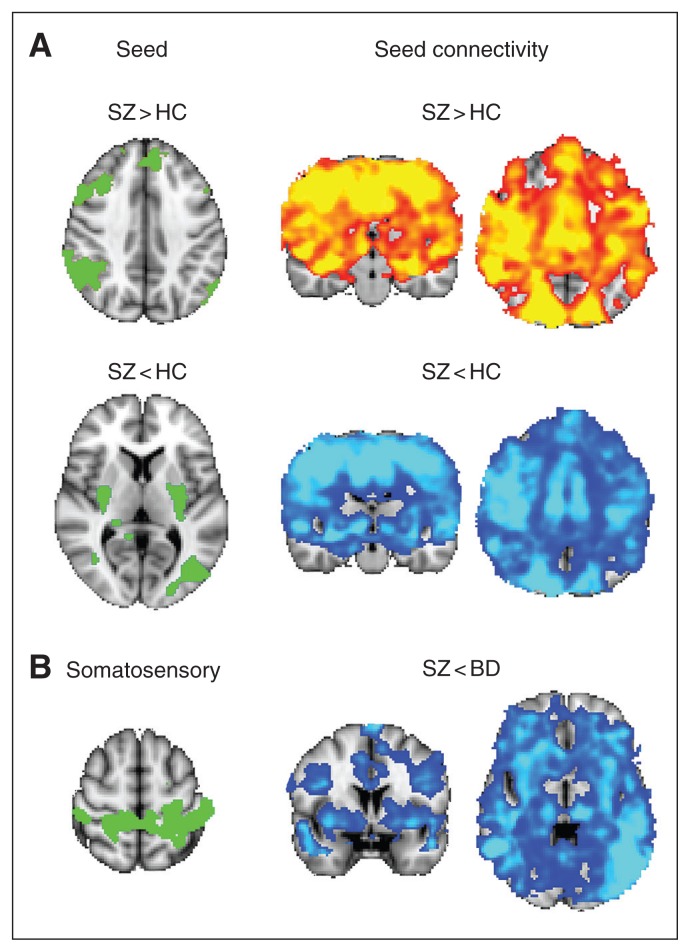
Fig. 3.
Seed-based functional brain connectivity. The 3 defined seeds are shown in green: namely, (A) the cluster from the F-test with increased and decreased centrality in patients with schizophrenia (SZ) compared with healthy controls (HC), and (B) a somatosensory seed with significantly different centrality between patients with schizophrenia and those with bipolar disorder (BD). Seed connectivity maps for the group contrast of interest are shown in yellow or blue, referring to (A) increased or decreased connectivity with the seed in patients with schizophrenia compared with healthy controls, respectively, and (B) decreased connectivity with the somatosensory seed in patients with schizophrenia compared with those with BD (p < 0.05, corrected).

