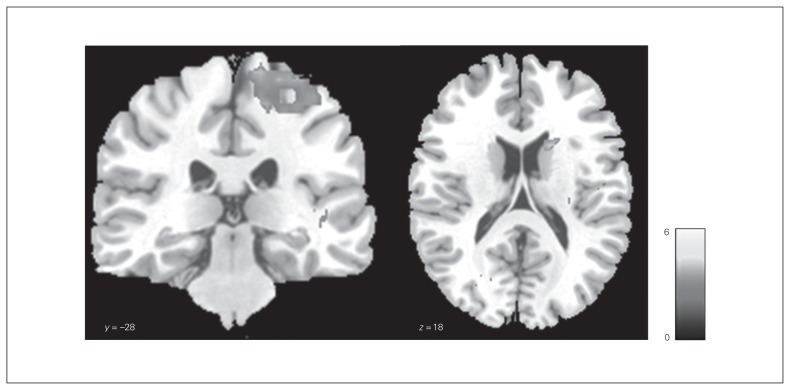
Fig. 1.
Group comparison of brain activation during the general no-go task. Differences in group activation between healthy controls and patients with bulimia nervosa with a high frequency of binge eating (controls > high-BN) during the contrast no-go_circle–go_square. The significance threshold was set at p < 0.05, cluster-level uncorrected. The SPM t-map was rendered on a T1-weighted template image supplied with mricron (Colin brain). The colour scale represents the t-scores.

