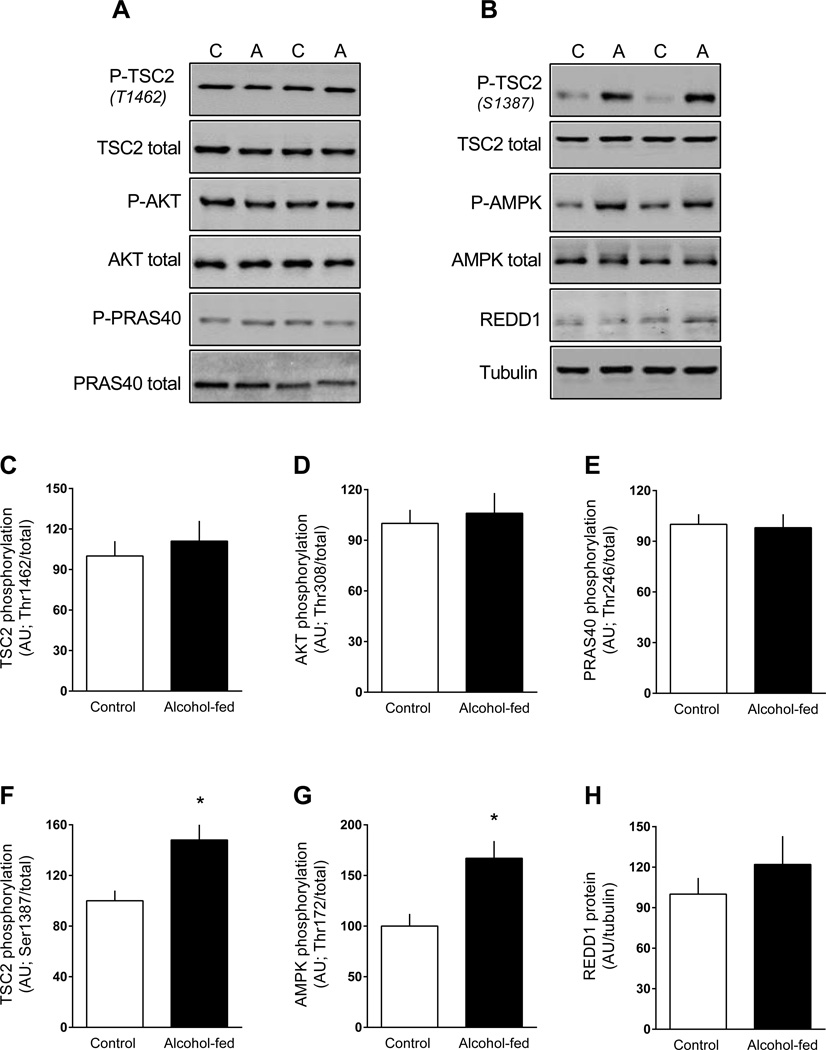
Figure 5.
Change in the phosphorylation state of proteins upstream of mTORC1 in eWAT from chronic alcohol-fed and pair-fed control mice. Quantitation of Western blots for the proteins TSC2, Akt, PRAS40, AMPK and REDD1. Unless, noted, values have been normalized to the total amount of the respective protein that did not change with alcohol (data not shown). Representative Western blots are presented (panels A and B) from eWAT isolated from two control and two alcohol-fed mice. Values are means ± SEM; n = 11 and 14, respectively. *P < 0.05 compared to time-matched control values.

