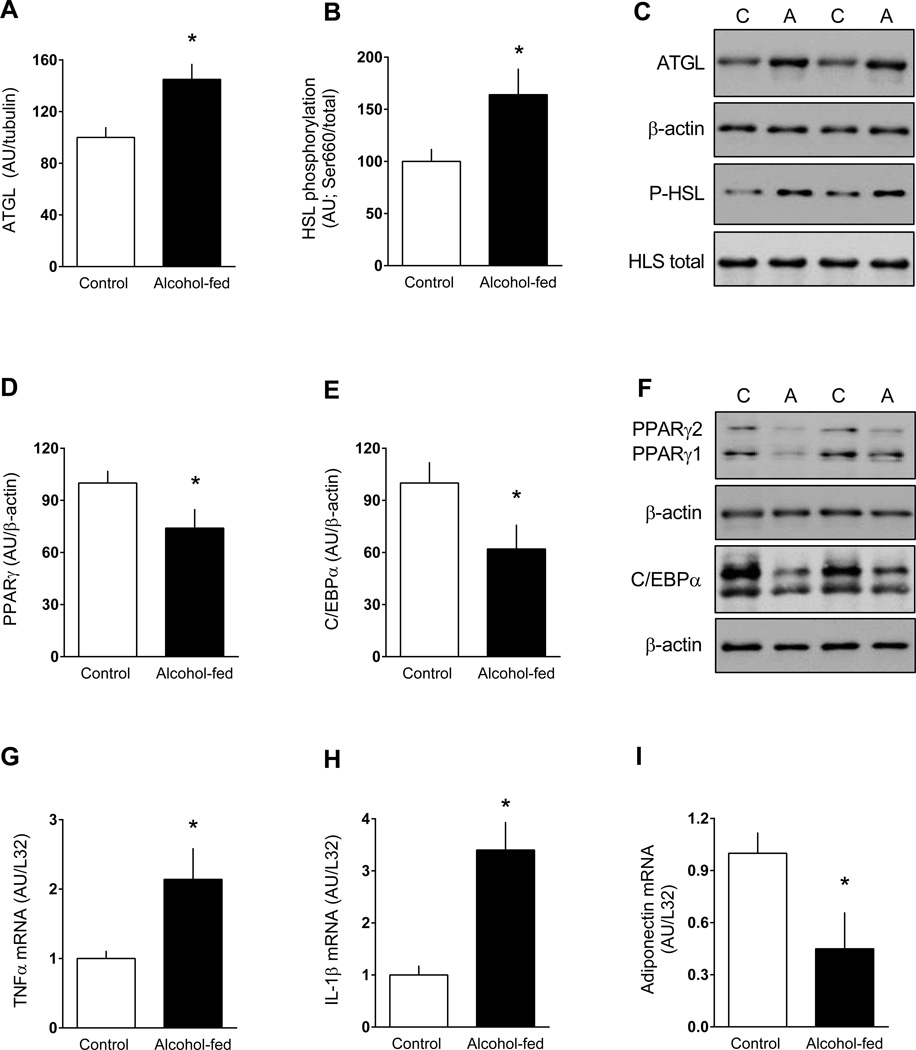
Figure 7.
Change in the total amount or phosphorylation state of proteins related to lipolysis or lipogenesis in eWAT from chronic alcohol-fed and pair-fed control mice. Bar graphs (A, B, D and E) are quantitation of Western blots. Values have been normalized to the total amount of the respective protein that did not change with alcohol (data not shown) or β-actin. Representative Western blots are presented (panels C and F) from eWAT isolated from two control and two alcohol-fed mice. For PPARγ, the antibody recognizes both PPARγ1 and PPARγ2 which have been identified; for C/EBPα, translation from alternative start codons results in two isoforms of C/EBPα (p42 and p30), which are seen on the gel. For these proteins, both bands were quantitated and presented graphically. Panels G-I are mRNA content for TNFα, IL1β and adiponectin normalized for L32. Values are means ± SEM; n = 11 and 14, respectively. *P < 0.05 compared to time-matched control values.

