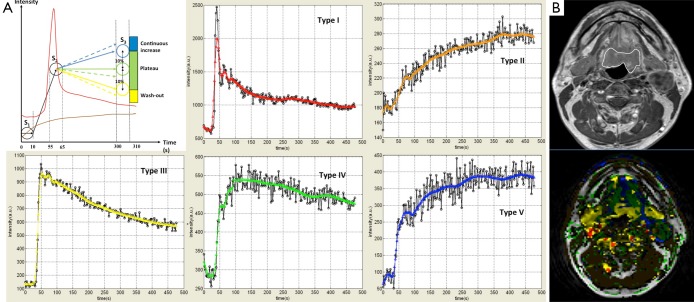
Figure 3.
Semi-quantitative analysis of DCE-MRI. (A) The illustration of a five-color-coding scheme for typical DCE-MRI time-intensity curves (TICs) to produce the color hue and color intensity coded maps. The black solid curves denote raw DCE-MRI TICs and the corresponding color curves denote the smoothed data; (B) the illustration of a color-coded map overlaid on a TSE anatomic image. The malignant tumor primarily shows fast wash-in and fast wash-out TIC pattern and is encoded in yellow. The normal tissues like muscle are primarily encoded in brown. MRI, magnetic resonance imaging.

