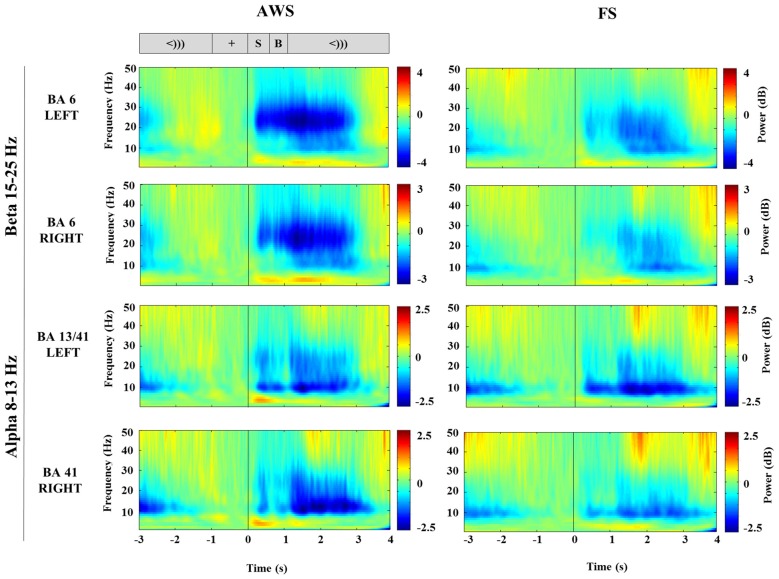
Figure 3.
Stimulus-locked time-frequency representation (TFR) plots of virtual sensors extracted from the bilateral mouth motor cortex (BA6) and auditory-sensory cortices (BA13/41) compared between AWS and FS. The corresponding task sequence time-line is displayed at the top for orientation and includes the fixation (+), stimulus sentence (S, 0.5 s), a blank screen (B, 0.5 s) and the cue to speak (<))), 3 s). Suppression (blue) is apparent following the stimulus presentation (S).

