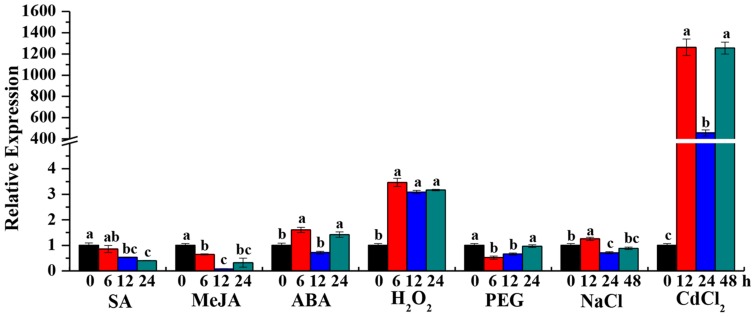
FIGURE 4.
Gene expression patterns of ScGluD2 under various abiotic stresses by qRT-PCR analysis. The samples of 4-month-old Yacheng05-179 plantlets, which used for qRT-PCR analysis, are treated by 5 mM SA, 25 μM MeJA, 100 μM ABA, 10 mM H2O2, 25% PEG 8000, 250 mM NaCl, and 500 μM CdCl2, respectively. Expression level of GAPDH is used as internal control. All data are represented as means of three replicates (n = 3) ± SE. Different lowercase letters indicate a significant difference (p-value < 0.05) compared to the control as determined by the least-significant difference test. SA, salicylic acid; MeJA, methyl jasmonate; ABA, abscisic acid; H2O2, hydrogen peroxide; PEG, polyethylene glycol; NaCl, sodium chloride; CdCl2, cadmium chloride.

