
Figure 2.
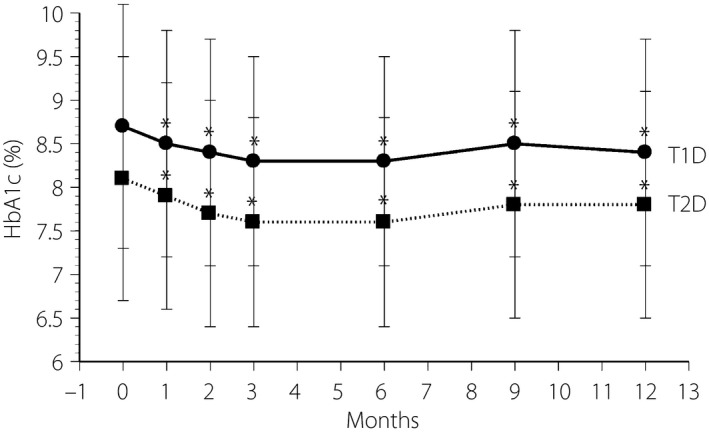
Time‐course of glycated hemoglobin (HbA1c) during the 1‐year study in type 1 diabetes (T1D) patients (circles, solid line) and type 2 diabetes (T2D) patients (squares, dotted line). *P < 0.01 vs baseline.
Official websites use .gov
A
.gov website belongs to an official
government organization in the United States.
Secure .gov websites use HTTPS
A lock (
) or https:// means you've safely
connected to the .gov website. Share sensitive
information only on official, secure websites.
Time‐course of glycated hemoglobin (HbA1c) during the 1‐year study in type 1 diabetes (T1D) patients (circles, solid line) and type 2 diabetes (T2D) patients (squares, dotted line). *P < 0.01 vs baseline.