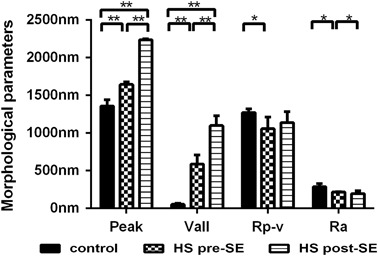
Fig. 3.

Comparison of erythrocyte morphological parameters. Peak: the maximum value of the z coordinate on the surface in the analyzed area; Vall: the minimum value of the z coordinate on the surface in the analyzed area; Rp-v: the difference between the peak and Vall; Ra: the average surface roughness of the erythrocyte. * p values < 0.05; ** p values < 0.01
