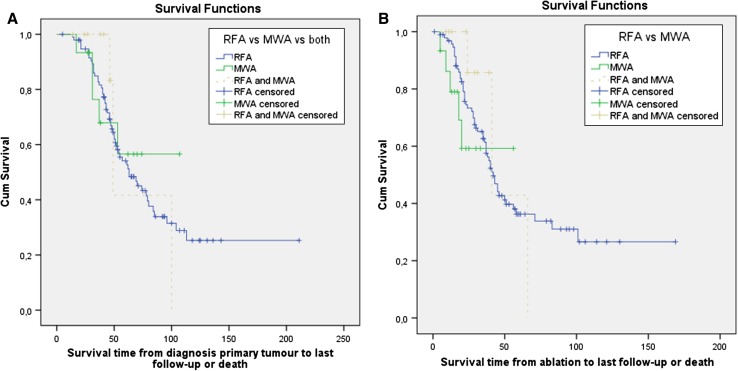
Fig. 2.
Kaplan–Meier curves showing overall survival from primary tumour diagnosis and from the first ablation procedure. Patients were distributed to the RFA group, MWA group or RFA plus MWA group based on the specific ablation procedures they had undergone. Survival distributions were not statistically different between the treatment groups for the survival times from primary tumour diagnosis (x2 = 0.215; P = 0.898) and from ablation (x2 = 1.161; P = 0.559)

