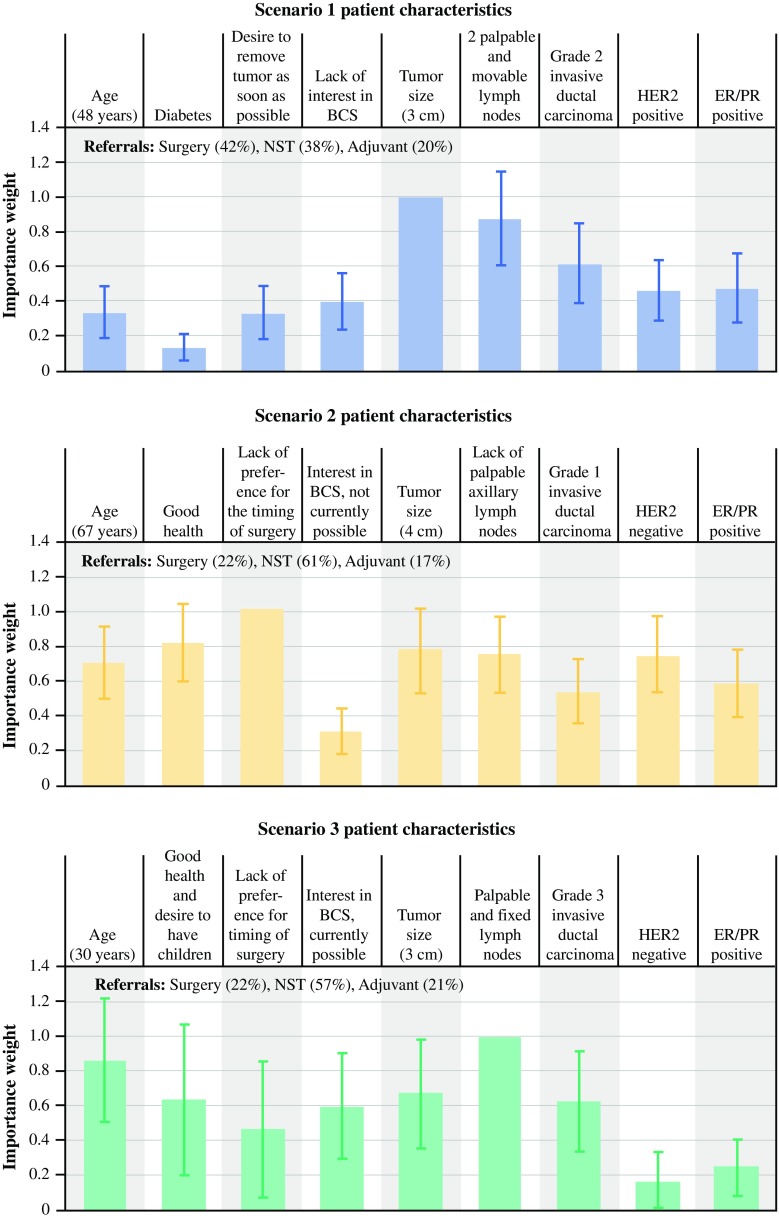
Fig. 5.
Relative ranking of factors by hypothetical patient scenario (n = 100). CI confidence interval. Note The vertical bars surrounding each mean preference weight denote the 95 % CI about the point estimate. “Tumor size,” “lack of preference for timing of surgery,” and “palpable and fixed lymph node” in patient scenarios 1, 2, and 3, respectively, do not have the 95 % CI because all the other factors were scaled relative to that factor

