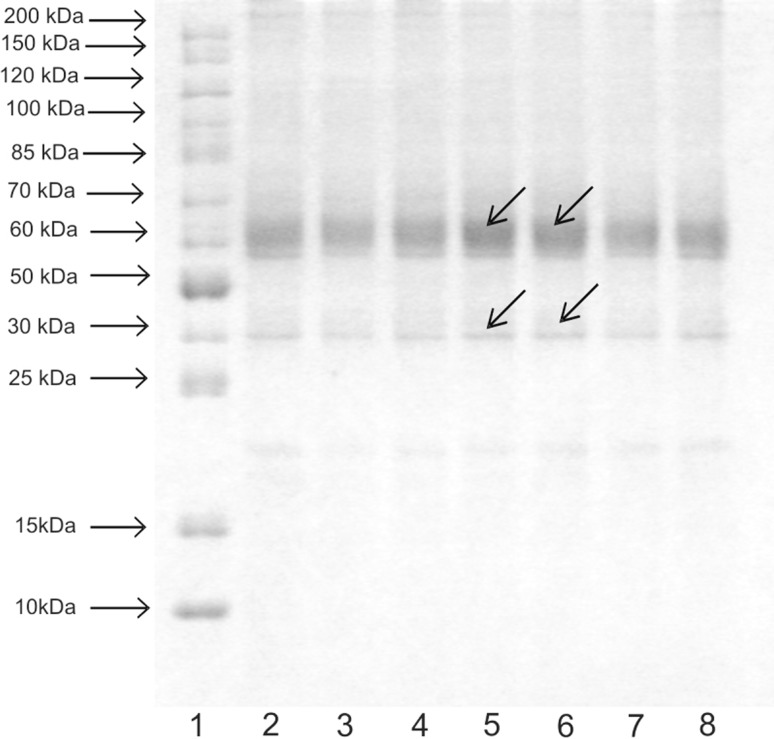
Fig. 5.
SDS-PAGE of the total proteins isolated from fibroblasts cultivated in the presence of 10−5-M and 10−6-M TA compared to the control culture (1 marker, 2 control, 3 10−5-M TA-treated cells day 3, 4 10−6-M TA-treated cells day 3, 5 10−5-M TA-treated cells day 4, 6 10−6-M TA-treated cells day 4, 7 10−5-M TA-treated cells day 5, 8 10−6-M TA-treated cells day 5)

