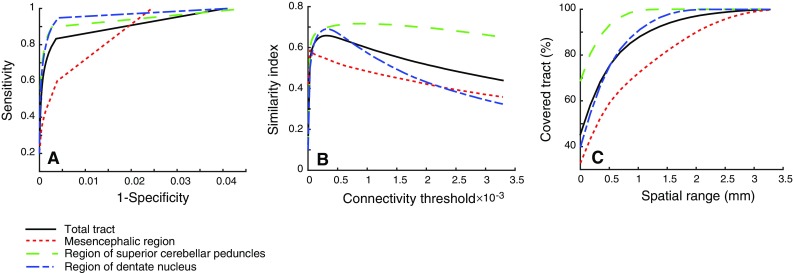
Fig. 7.

ROC curves for total tract and separate regions averaged for both left and right DRTT. b Similarity index as a function of the connectivity threshold. c Spatial extent of the FNs at optimal threshold. The optimal threshold is defined as the threshold where the similarity index is maximal
