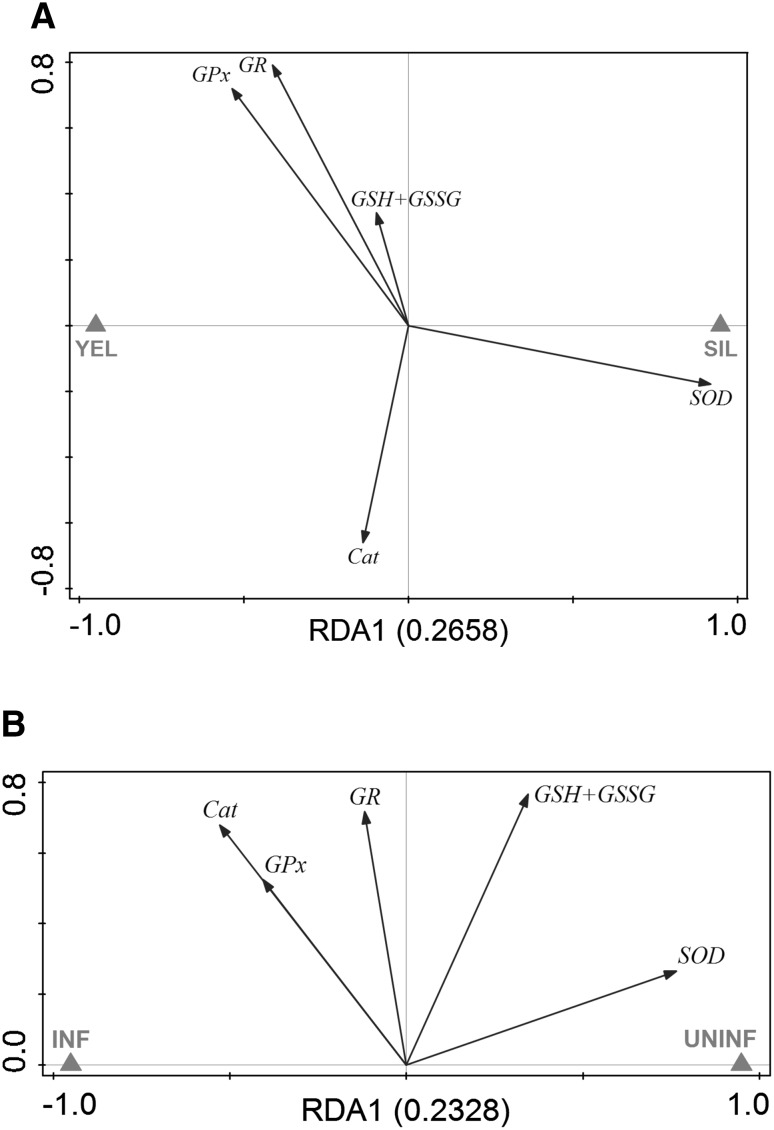
Fig. 5.
Redundancy analyses containing developmental stage within uninfected eels (a) or infection status within silver eels (b) as explanatory variable and all response variables in muscle tissue. Eigenvalues (explained variation) given with axis labels. YEL yellow eel, SIL silver eel, INF infected, UNINF not infected. Significances of effects determined by CANOCO Monte-Carlo tests (4999 permutations). Pseudo-F = 3.6, P = 0.0022 (a), Pseudo-F = 3.0, P = 0.0242 (b)

