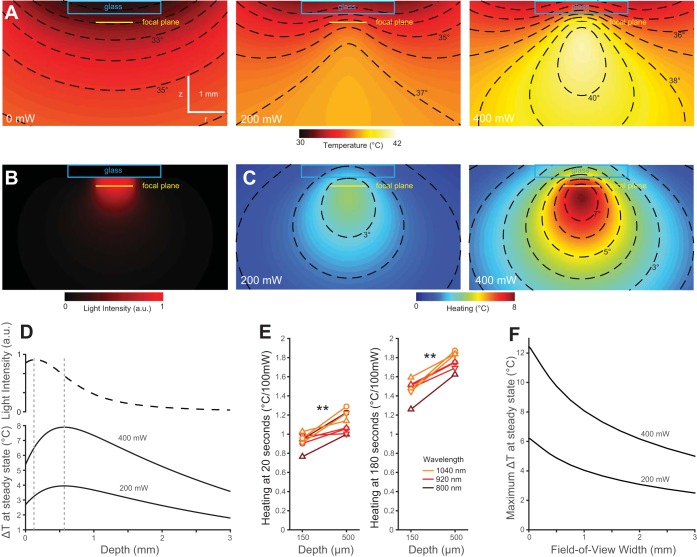
Fig. 3.
Heating is greatest deep below the brain surface. A: simulated spatial temperature profile in brain tissue with overlaid cover glass and immersion water. The temperature of the immersion water was held at 25°C 1.5 mm above the window glass. Profiles are shown for no illumination, 200 mW, and 400 mW of laser power raster scanned as in B. B: time-integrated light intensity cross section through the center of the scan volume for the 1-mm2 scan at 920 nm used in simulations. C: simulated temperature changes at 200 and 400 mW. Contour lines are shown for 1°C intervals in A–C. D: simulated time-integrated light intensity in a 150-μm radius of the scan area center, at varying depth from the brain surface (top), and steady-state heating in the same 150-μm radius, shown for 400- and 200-mW illumination powers (bottom). E: heating coefficients measured by thermocouple contact thermometry at depths of 150 and 500 μm below the dura (N = 3 mice). F: maximum temperature change for 200-mW simulated square scans of different field widths.

