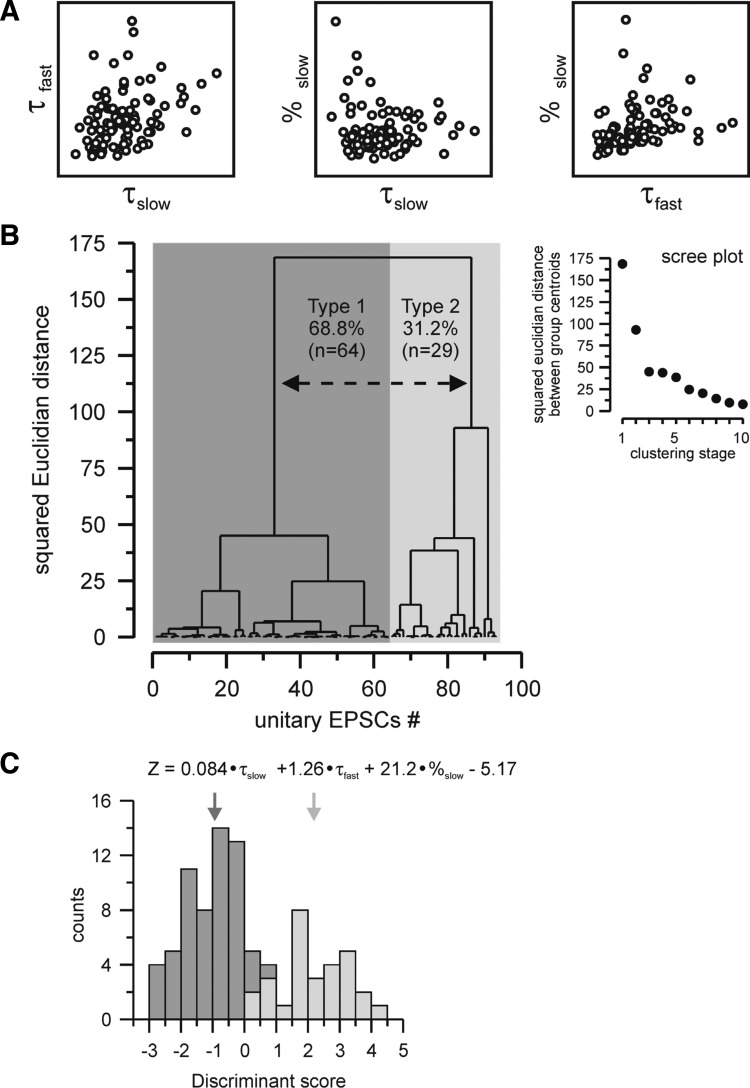
Fig. 2.
Classification of minimal EPSCs in nRt cells. A: relationship between parameters chosen for hierarchical clustering, with each circle representing an individual EPSC. The slow (τslow) and fast (τfast) decay time constants and the contribution of the slow component (%slow) showed little correlation. B: dendrogram resulting from hierarchical cluster analysis of the total population of minimal EPSCs. Average within-cluster distance represents the squared Euclidian distance between centroids of the merged cluster at each branch point (the length of vertical lines being proportional to the magnitude of difference). Unitary EPSCs were sorted by closeness along the x-axis. Inset, scree plot depicting squared Euclidian distances between group centroids during the first 10 clustering stages. Large distances between successive stages are indicative of significant improvement of the classification. Since a such clear division was detected after the first stage but substantially decreased from the second stage; two final groups of synaptic responses were therefore determined, type 1 and type 2, represented by the dashed line on the dendrogram. C: multiple discriminant analysis determined the variables most useful in predicting group membership, and the resultant discriminant function is shown. Note that %slow has the strongest raw discriminating weight. The histogram shows discriminant scores (Z) for the responses previously grouped by hierarchical clustering and indicates that the discriminant function accurately predicts group membership: the two types of events are almost completely nonoverlapping in their distributions. Type 1 responses (dark gray bars) had a mean Z value of −0.99 ± 0.94 (mean ± SD, n = 64, dark gray arrow), whereas type 2 responses (light gray bars) had a mean Z value of 2.19 ± 1.12 (mean ± SD, n = 29, light gray arrow). There was a small overlap region between Z values of 0 and 1; however, no type 2 responses were observed with Z scores < 0 and no type 1 responses with Z scores >1.

