Fig. 3.
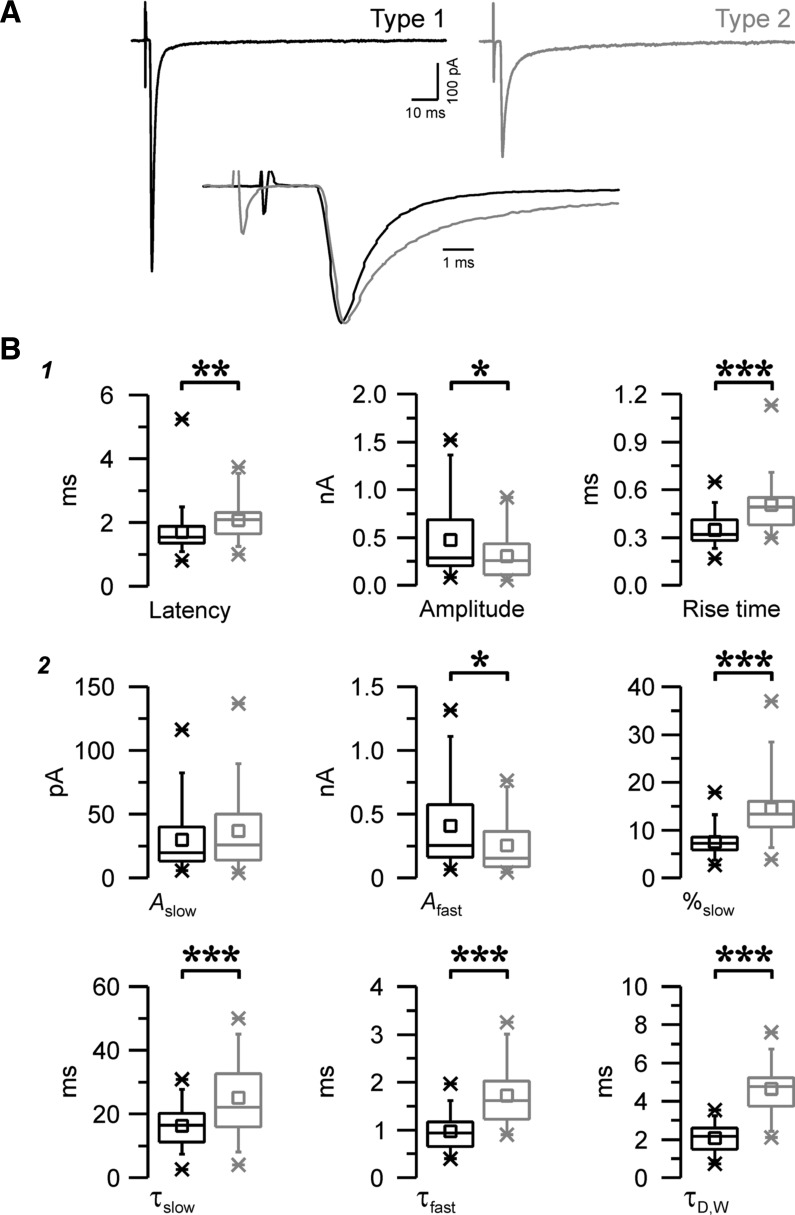
Distinct properties of the two populations of evoked EPSCs. A: examples of a type 1 response (black, left trace) and a type 2 response (gray, right trace) evoked by minimum stimulation in two nRt cells at a holding potential of −70 mV. Each trace is the average of ∼10 EPSCs. Bottom, overlay of the top traces normalized to the peak and aligned to the onset of the response, showing differences in time course between the two EPSCs. B: properties and kinetics of type 1 (black, n = 64) and type 2 (gray, n = 29) evoked EPSCs. Parameters were obtained either from the statistics of the averaged traces (1) or extracted from the fitted double-exponential decay functions (2). Note that overall type 1 EPSCs were larger (amplitude) and faster [smaller rise time, τfast, τslow, and weighted decay time constant (τD,W)] and the contribution of the slow component (%slow) was more prominent in type 2. Afast and Aslow are the fast and slow amplitude components, respectively. *P < 0.05; **P < 0.01; ***P < 0.001.

