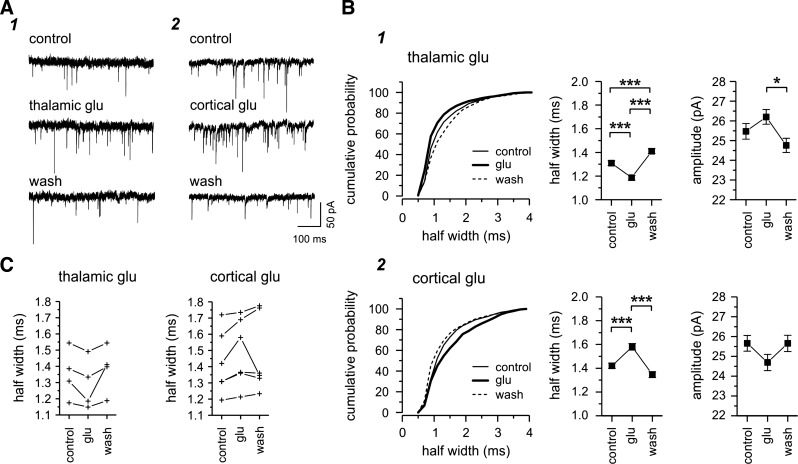
Fig. 4.
Glutamate (Glu) activation of thalamic or cortical neurons. A: examples of spontaneously occurring EPSCs recorded in two different nRt cells before (control), during (thalamic or cortical glutamate), and after glutamate application (wash) in the thalamus (1; 25 μM glutamate) or cortex (2; 200 μM glutamate) in horizontal or TC slices, respectively. Glutamate activation resulted in an increased number of EPSCs. B: subsequent analysis of all EPSCs recorded in the same cells and conditions as in A. Equivalent periods of recording were analyzed in each condition (1 min for the VB and 30 s for the cortex). The cumulative probability curve for half-width of all EPSCs showed a leftward shift (i.e more fast events) during glutamate activation (thick curve) in the thalamus (B1) but a right shift (i.e., more slow events) during cortical glutamate (B2). These opposite changes occurring during thalamic or cortical glutamate are also reflected in the mean half-width as well as amplitude (chevron plots) with an increased amplitude during glutamate activation in the thalamus but a decreased amplitude during glutamate application in the cortex, although the differences were not statistically different. C: glutamate-induced changes for the total population of nRt cells. Each line represents a nRt cell. In each case, thalamic application (left) resulted in a decreased mean half-width, whereas cortical application (right) resulted in an increased mean half-width. In most cases, the changes were reversible. Overall, the majority of fast and large events were triggered by glutamate activation of thalamic neurons, and these properties were reminiscent of type 1 evoked EPSCs. In contrast, occurrence of slow and small events seemed to predominate during the activation of cortical neurons, resembling the properties of type 2 EPSCs. *P < 0.05; ***P < 0.001.

