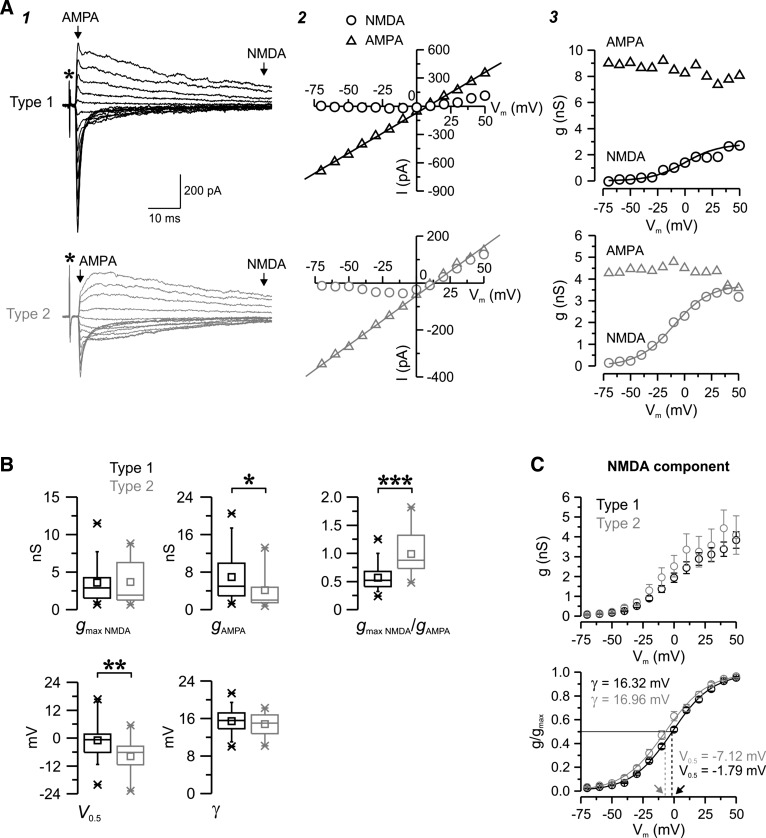
Fig. 5.
Voltage dependence of the two populations of evoked EPSCs. A: examples of unitary type 1 (black) and type 2 (gray) EPSCs triggered by minimum stimulation in nRt cells in control conditions while the membrane potential was held at different levels (1) together with the corresponding current-voltage (I–V; 2) and conductance-voltage (g–V; 3) relationship. Each trace is the average of two (type 1) or three (type 2) trials. *Time of stimulation (A1). The putative α-amino-3-hydroxy-5-methyl-4-isoxazolepropionic acid (AMPA; triangles) and N-methyl-d-aspartate (NMDA; circles) currents were measured at the times indicated by the arrows in A1. AMPA I–V and NMDA g–V curves were fitted with a linear regression (line in A2) and a Boltzmann function (line in A3), respectively, and parameters were extracted from fits. For these prototypical responses, the following fitted curve parameters were obtained: maximal NMDA conductance (gmax NMDA; in nS), 2.83 for type 1 vs. 3.73 for type 2; apparent dissociation constant for Mg2+ block at a membrane potential of 0 mV (KMg), 0.7 mM for type 1 vs. 1.3 mM for type 2; electrical distance of the Mg2+-binding site in the membrane field (δ), 0.85 for type 1 vs. 0.79 for type 2; voltage at which 50% of the conductance was activated (V0.5), 0.09 mV for type 1 vs. −9.88 for type 2; slope factor (γ), 15.6 mV for type 1 vs. 16.7 mV for type 2; AMPA conductance (gampa), 8.6 nS for type 1 vs. 4.2 nS for type 2; and gmax NMDA/gAMPA, 0.33 for type 1 vs. 0.89 for type 2. B: population statistics for type 1 (black, n = 48) and type 2 (gray, n = 17) EPSCs. Note the more prominent contribution of the NMDA component in type 2, reflected by a higher ratio between gmax NMDA and gampa. V0.5 was more hyperpolarized in type 2, suggesting reduced sensitivity to Mg2+ block. *P < 0.05; **P < 0.01; ***P < 0.001. C: population data for NMDA. Averaged (top graph) and normalized (bottom graph) NMDA g-V curves of type 1 (black) and type 2 (gray) responses are shown. Fitted curves (curved line) had similar γ values but distinct V0.5 values (see methods), thus confirming the differences in sensitivity to voltage-dependent Mg2+ block between the two types. Arrows indicate differences in V0.5 values between type 1 and type 2 EPSCs, i.e., the voltage (straight dotted lines) at which 50% of the maximum conductance is activated (straight black line).

