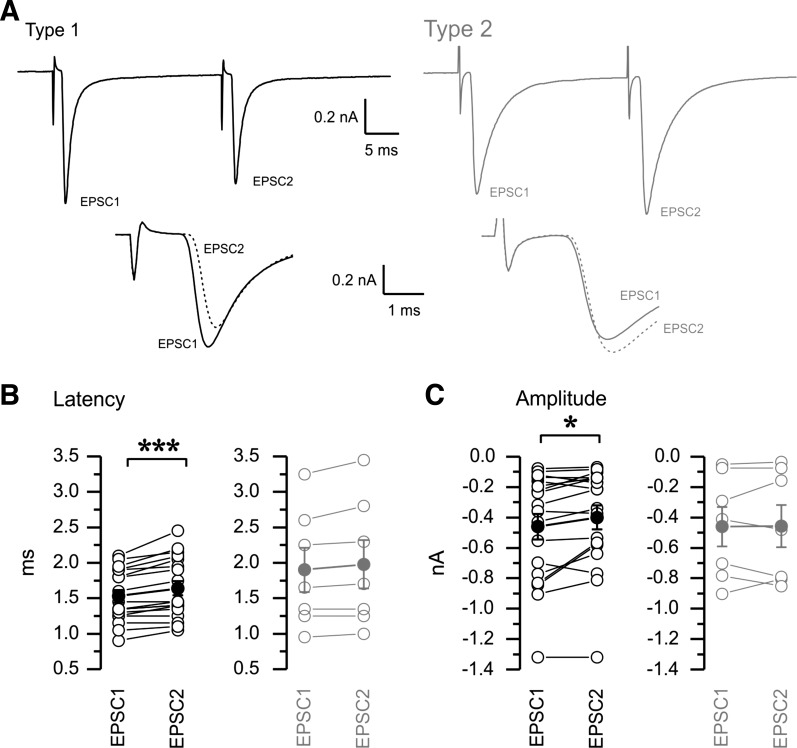
Fig. 8.
Short-term plasticity properties of type 1 (black) and type 2 (gray) responses. A: a pair of minimal stimuli were delivered at a frequency of 40 Hz. Type 1 responses tended to show paired pulse suppression and slowing of response latency in the second pulse (bottom overlay of EPSC1 and EPSC2 aligned to the stimulus time), whereas type 2 responses showed little paired pulse amplitude or latency differences. B: population statistics for short-term latency plasticity. Paired statistical comparison showed increases in latency for the second pulse compared with the first pulse in type 1 (left) but not type 2 (right) responses. C: population statistics for short-term amplitude plasticity. Solid symbols with error bars represent means ± SE of individual values (B and C). The paired statistical comparison documents the paired pulse depression, i.e., decreases in amplitude for the second pulse compared with the first pulse in type 1 but not type 2 responses. Type 1: n = 18; type 2: n = 7. *P < 0.05; ***P < 0.001.

