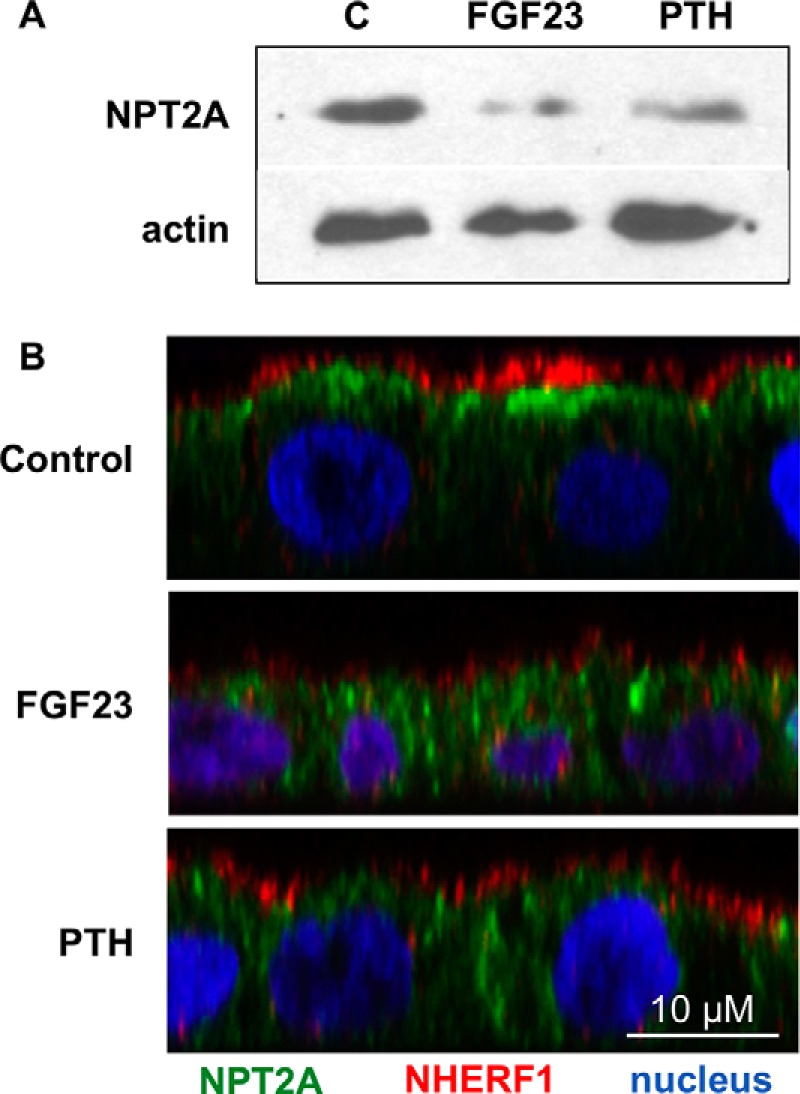
FIGURE 9.

PTH and FGF23 down-regulation of NPT2A. A, NPT2A protein levels in RPTECs after a 2-h treatment with PTH or FGF23. A representative experiment is presented. B, immunofluorescence experiments depicting the change in localization of NPT2A in response to PTH or FGF23 treatment. RPTECs were left untreated (control) or treated for 2 h with 100 nm PTH or FGF23. Green, NPT2A; red, NHERF1; blue, nuclei. The x-z plane is depicted.
