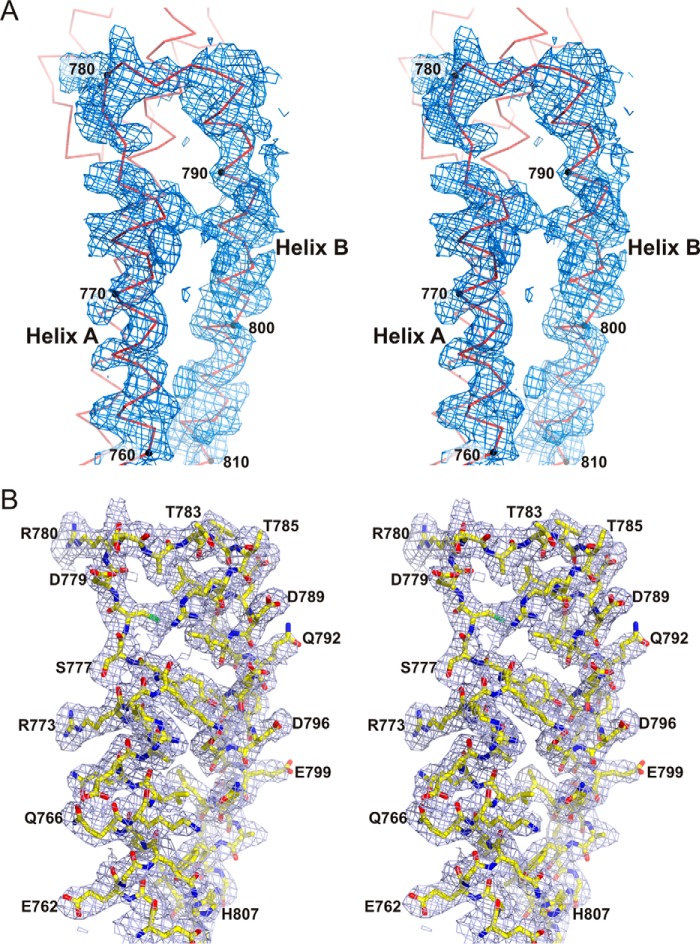
FIGURE 13.
Electron density maps of the SR5-SR6-ΔSH3-A crystal structure. A, stereo view of a representative section of a map calculated with the phases obtained by SIRAS with autoSHARP after improvement by density modification with Solomon. The density is contoured a 1σ. The Cα trace of this section of the structure is shown. B, stick representation of the refined structure of the region shown in A, superimposed onto a feature-enhanced 2mFobs − DFmodel map calculated at the final stage of refinement (contoured at 1σ).

